
2015 Schield Logistic MLE1A Excel2013 10/29/2015 V0D 2015-Schield-Logistic-MLE1A-Excel2013-Slides.pdf 1
2015 Schield Logistic MLE 1A Excel2013 SlidesV0D 1
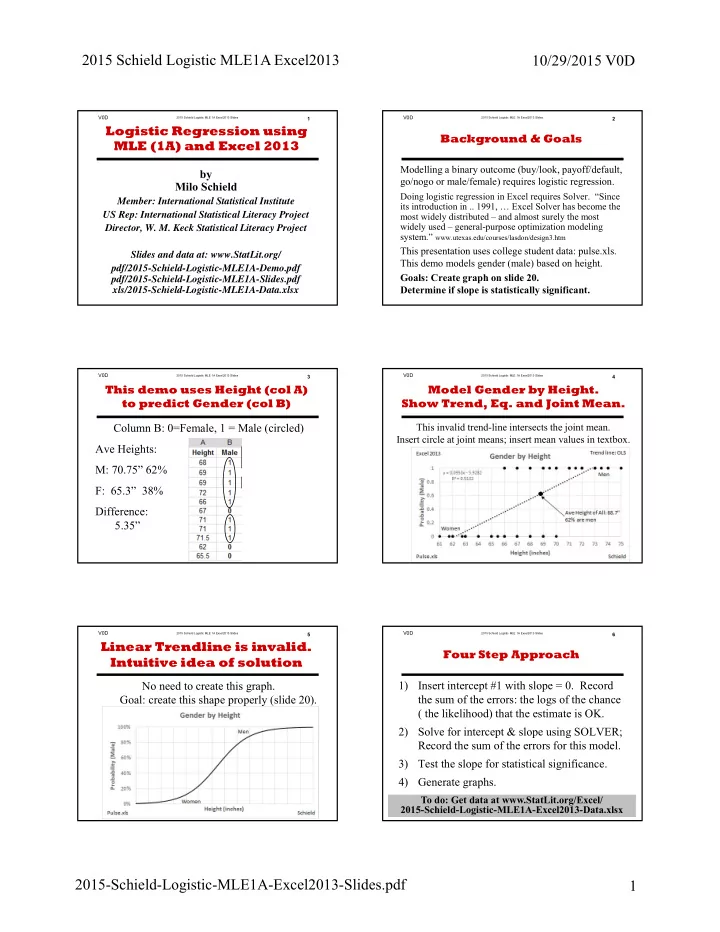
by Milo Schield
Member: International Statistical Institute US Rep: International Statistical Literacy Project Director, W. M. Keck Statistical Literacy Project Slides and data at: www.StatLit.org/ pdf/2015-Schield-Logistic-MLE1A-Demo.pdf pdf/2015-Schield-Logistic-MLE1A-Slides.pdf xls/2015-Schield-Logistic-MLE1A-Data.xlsx
Logistic Regression using MLE (1A) and Excel 2013
2015 Schield Logistic MLE 1A Excel2013 SlidesV0D 2
Background & Goals
Modelling a binary outcome (buy/look, payoff/default, go/nogo or male/female) requires logistic regression.
Doing logistic regression in Excel requires Solver. “Since its introduction in .. 1991, … Excel Solver has become the most widely distributed – and almost surely the most widely used – general-purpose optimization modeling system.” www.utexas.edu/courses/lasdon/design3.htm
This presentation uses college student data: pulse.xls. This demo models gender (male) based on height. Goals: Create graph on slide 20. Determine if slope is statistically significant.
2015 Schield Logistic MLE 1A Excel2013 SlidesV0D
Column B: 0=Female, 1 = Male (circled) Ave Heights: M: 70.75” 62% F: 65.3” 38% Difference: 5.35”
3
This demo uses Height (col A) to predict Gender (col B)
2015 Schield Logistic MLE 1A Excel2013 SlidesV0D 4
Model Gender by Height. Show Trend, Eq. and Joint Mean.
This invalid trend-line intersects the joint mean. Insert circle at joint means; insert mean values in textbox.
2015 Schield Logistic MLE 1A Excel2013 SlidesV0D 5
Linear Trendline is invalid. Intuitive idea of solution
No need to create this graph. Goal: create this shape properly (slide 20).
2015 Schield Logistic MLE 1A Excel2013 SlidesV0D
1) Insert intercept #1 with slope = 0. Record the sum of the errors: the logs of the chance ( the likelihood) that the estimate is OK. 2) Solve for intercept & slope using SOLVER; Record the sum of the errors for this model. 3) Test the slope for statistical significance. 4) Generate graphs.
6
Four Step Approach
To do: Get data at www.StatLit.org/Excel/ 2015-Schield-Logistic-MLE1A-Excel2013-Data.xlsx