discriminant analysis using logistic regression ols1d
play

Discriminant Analysis using Logistic Regression OLS1D XL4E: V0D XL4E - PDF document

Discriminant Analysis using Logistic Regression OLS1D XL4E: V0D XL4E : OLS1D V0D XL4E : OLS1D V0D 2016 Schield Logistic Regression using OLS1D in Excel2013 1 2016 Schield Logistic Regression using OLS1D in Excel2013 2 Discriminant Analysis


  1. Discriminant Analysis using Logistic Regression OLS1D XL4E: V0D XL4E : OLS1D V0D XL4E : OLS1D V0D 2016 Schield Logistic Regression using OLS1D in Excel2013 1 2016 Schield Logistic Regression using OLS1D in Excel2013 2 Discriminant Analysis Discriminant Analysis: using Logistic Regression Outcome must be Categorical Definition : A statistical technique used to classify by objects into groups (to predict membership in groups). Milo Schield Two-Group (Binary) Examples: Member: International Statistical Institute Admission to grad, law or medical school US Rep: International Statistical Literacy Project Passing a test (CPA, CMA, etc.) Director, W. M. Keck Statistical Literacy Project Toxicity of a substance on insects (causes death in some) Making a loan; Bankruptcy Slides, output and data at: www.StatLit.org/ Winning an election; Being unemployed pdf/2016-Schield-Logistic-OLS1D-Excel2013-Slides.pdf Use of contraceptives; Driving drunk pdf/2016-Schield-Logistic-OLS1D-Excel2013-Demo.pdf Pregnancy or divorce; Heart attack or Alzheimer's Excel/2016-Schield-Logistic-OLS1D-Excel2013-Data.xlsx XL4E : OLS1D V0D 2016 Schield Logistic Regression using OLS1D in Excel2013 3 XL4E : OLS1D V0D 2016 Schield Logistic Regression using OLS1D in Excel2013 4 Discriminant Analysis 1a: Model gender on Height Uses Regression Modelling a binary outcome (loan vs. no-loan) requires logistic regression. This presentation classifies college students by gender based on their height and weight. Three logistic models are referenced: * www.statlit.org/pdf/2015-Schield-Logistic-OLS1A-slides.pdf * www.statlit.org/pdf/2015-Schield-Logistic-OLS1B-slides.pdf * www.statlit.org/pdf/2015-Schield-Logistic-OLS1C-slides.pdf XL4E : OLS1D V0D 2016 Schield Logistic Regression using OLS1D in Excel2013 5 XL4E : OLS1D V0D 2016 Schield Logistic Regression using OLS1D in Excel2013 6 1b: Predict Sex given Height 1c: Predict Sex given Height: Diamond=Male; Circle=Female Error Analysis Close-up . . 2016-Schield-Logistic-OLS1D-Excel2013-Slides.pdf 1

  2. Discriminant Analysis using Logistic Regression OLS1D XL4E: V0D XL4E : OLS1D V0D XL4E : OLS1D V0D 2016 Schield Logistic Regression using OLS1D in Excel2013 7 2016 Schield Logistic Regression using OLS1D in Excel2013 8 1d. Predict Sex given Height: 2a. Model Gender on Weight Error Analysis Summary . . XL4E : OLS1D V0D 2016 Schield Logistic Regression using OLS1D in Excel2013 9 XL4E : OLS1D V0D 2016 Schield Logistic Regression using OLS1D in Excel2013 10 2b. Predict Sex given Weight 2c. Predict Sex given Weight Diamond=Male; Circle=Female Error Analysis Close-Up . . XL4E : OLS1D V0D 2016 Schield Logistic Regression using OLS1D in Excel2013 11 XL4E : OLS1D V0D 2016 Schield Logistic Regression using OLS1D in Excel2013 12 2d. Predict Sex given Weight 3a. Model Gender on Error Analysis Summary Height and Weight . . 2016-Schield-Logistic-OLS1D-Excel2013-Slides.pdf 2

  3. Discriminant Analysis using Logistic Regression OLS1D XL4E: V0D XL4E : OLS1D V0D XL4E : OLS1D V0D 2016 Schield Logistic Regression using OLS1D in Excel2013 13 2016 Schield Logistic Regression using OLS1D in Excel2013 14 3b. Model Gender on 3c. Model Gender on Height and Weight Height and Weight P(male) = 50%: 66.37 = 0.759*Ht+0.11*Wt . Weight(P50) = (66.37 – 0.759*Height) / 0.11 XL4E : OLS1D V0D 2016 Schield Logistic Regression using OLS1D in Excel2013 15 XL4E : OLS1D V0D 2016 Schield Logistic Regression using OLS1D in Excel2013 16 3d. Model Gender on Ht & Wt: 3e. Model Gender on Ht & Wt: Error Close-up Error Summary . . XL4E : OLS1D V0D 2016 Schield Logistic Regression using OLS1D in Excel2013 17 XL4E : OLS1D V0D 2016 Schield Logistic Regression using OLS1D in Excel2013 18 Summary Appendix Using just height, 19.6% are mis-classified. Q. Why not just use the average? Mean height or weight? Using just weight, 13.0% are misclassified. A. Group average is influenced by the outcome mix. Logistic regression models the chance of the outcome. Using both height and weight, 13.0% are misclassified. Chance is not influenced by the outcome mix. ======================================== What is the advantage of using weight instead of height? 34% reduction in error: (13-19.6)/19.6 Interpreting the coefficients in Logistic Regression: This important topic is beyond this introductory presentation. Disadvantage of using both height & weight vs. weight? More complex. Can’t show in 2D. Read The Chicago Guide to “Writing about Multivariate Analysis” by Jane Miller. See p. 220-243 and 418-431. Advantage of using both height & weight vs. weight? Probably better at handling future subjects. 2016-Schield-Logistic-OLS1D-Excel2013-Slides.pdf 3

  4. XL4E : OLS1D V0D 2016 Schield Logistic Regression using OLS1D in Excel2013 1 Discriminant Analysis using Logistic Regression 
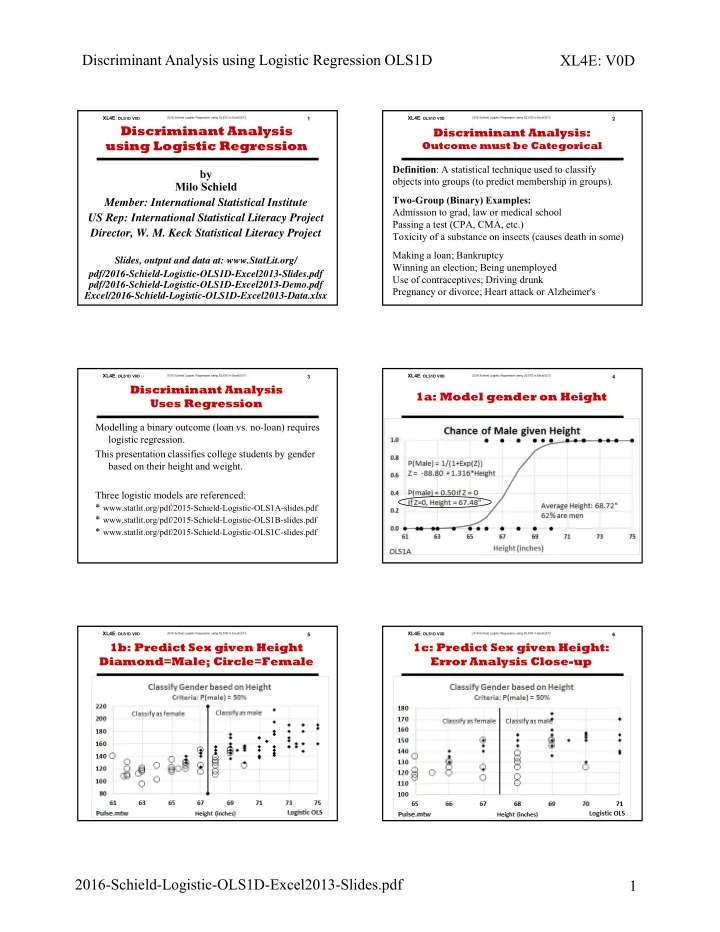
by Milo Schield Member: International Statistical Institute US Rep: International Statistical Literacy Project Director, W. M. Keck Statistical Literacy Project Slides, output and data at: www.StatLit.org/ pdf/2016-Schield-Logistic-OLS1D-Excel2013-Slides.pdf pdf/2016-Schield-Logistic-OLS1D-Excel2013-Demo.pdf Excel/2016-Schield-Logistic-OLS1D-Excel2013-Data.xlsx

  5. XL4E : OLS1D V0D 2016 Schield Logistic Regression using OLS1D in Excel2013 2 Discriminant Analysis: Outcome must be Categorical Definition : A statistical technique used to classify objects into groups (to predict membership in groups). Two-Group (Binary) Examples: Admission to grad, law or medical school Passing a test (CPA, CMA, etc.) Toxicity of a substance on insects (causes death in some) Making a loan; Bankruptcy Winning an election; Being unemployed Use of contraceptives; Driving drunk Pregnancy or divorce; Heart attack or Alzheimer's

  6. XL4E : OLS1D V0D 2016 Schield Logistic Regression using OLS1D in Excel2013 3 Discriminant Analysis Uses Regression Modelling a binary outcome (loan vs. no-loan) requires logistic regression. This presentation classifies college students by gender based on their height and weight. Three logistic models are referenced: * www.statlit.org/pdf/2015-Schield-Logistic-OLS1A-slides.pdf * www.statlit.org/pdf/2015-Schield-Logistic-OLS1B-slides.pdf * www.statlit.org/pdf/2015-Schield-Logistic-OLS1C-slides.pdf

  7. XL4E : OLS1D V0D 2016 Schield Logistic Regression using OLS1D in Excel2013 4 1a: Model gender on Height

  8. XL4E : OLS1D V0D 2016 Schield Logistic Regression using OLS1D in Excel2013 5 1b: Predict Sex given Height Diamond=Male; Circle=Female .

  9. XL4E : OLS1D V0D 2016 Schield Logistic Regression using OLS1D in Excel2013 6 1c: Predict Sex given Height: Error Analysis Close-up .

  10. XL4E : OLS1D V0D 2016 Schield Logistic Regression using OLS1D in Excel2013 7 1d. Predict Sex given Height: Error Analysis Summary .

  11. XL4E : OLS1D V0D 2016 Schield Logistic Regression using OLS1D in Excel2013 8 2a. Model Gender on Weight .

  12. XL4E : OLS1D V0D 2016 Schield Logistic Regression using OLS1D in Excel2013 9 2b. Predict Sex given Weight Diamond=Male; Circle=Female .

  13. XL4E : OLS1D V0D 2016 Schield Logistic Regression using OLS1D in Excel2013 10 2c. Predict Sex given Weight Error Analysis Close-Up .

  14. XL4E : OLS1D V0D 2016 Schield Logistic Regression using OLS1D in Excel2013 11 2d. Predict Sex given Weight Error Analysis Summary .

  15. XL4E : OLS1D V0D 2016 Schield Logistic Regression using OLS1D in Excel2013 12 3a. Model Gender on Height and Weight .

  16. XL4E : OLS1D V0D 2016 Schield Logistic Regression using OLS1D in Excel2013 13 3b. Model Gender on Height and Weight P(male) = 50%: 66.37 = 0.759*Ht+0.11*Wt Weight(P50) = (66.37 – 0.759*Height) / 0.11

  17. XL4E : OLS1D V0D 2016 Schield Logistic Regression using OLS1D in Excel2013 14 3c. Model Gender on Height and Weight .

  18. XL4E : OLS1D V0D 2016 Schield Logistic Regression using OLS1D in Excel2013 15 3d. Model Gender on Ht & Wt: Error Close-up .

  19. XL4E : OLS1D V0D 2016 Schield Logistic Regression using OLS1D in Excel2013 16 3e. Model Gender on Ht & Wt: Error Summary .

  20. XL4E : OLS1D V0D 2016 Schield Logistic Regression using OLS1D in Excel2013 17 Summary Using just height, 19.6% are mis-classified. Using just weight, 13.0% are misclassified. Using both height and weight, 13.0% are misclassified. What is the advantage of using weight instead of height? 34% reduction in error: (13-19.6)/19.6 Disadvantage of using both height & weight vs. weight? More complex. Can’t show in 2D. Advantage of using both height & weight vs. weight? Probably better at handling future subjects.

  21. XL4E : OLS1D V0D 2016 Schield Logistic Regression using OLS1D in Excel2013 18 Appendix Q. Why not just use the average? Mean height or weight? A. Group average is influenced by the outcome mix. Logistic regression models the chance of the outcome. Chance is not influenced by the outcome mix. ======================================== Interpreting the coefficients in Logistic Regression: This important topic is beyond this introductory presentation. Read The Chicago Guide to “Writing about Multivariate Analysis” by Jane Miller. See p. 220-243 and 418-431.

Download Presentation
Download Policy: The content available on the website is offered to you 'AS IS' for your personal information and use only. It cannot be commercialized, licensed, or distributed on other websites without prior consent from the author. To download a presentation, simply click this link. If you encounter any difficulties during the download process, it's possible that the publisher has removed the file from their server.

Recommend


More recommend