
SLIDE 1
Discriminant Analysis
- aka. Discriminant Function Analysis
Discriminant Analysis aka. Discriminant Function Analysis - - PowerPoint PPT Presentation
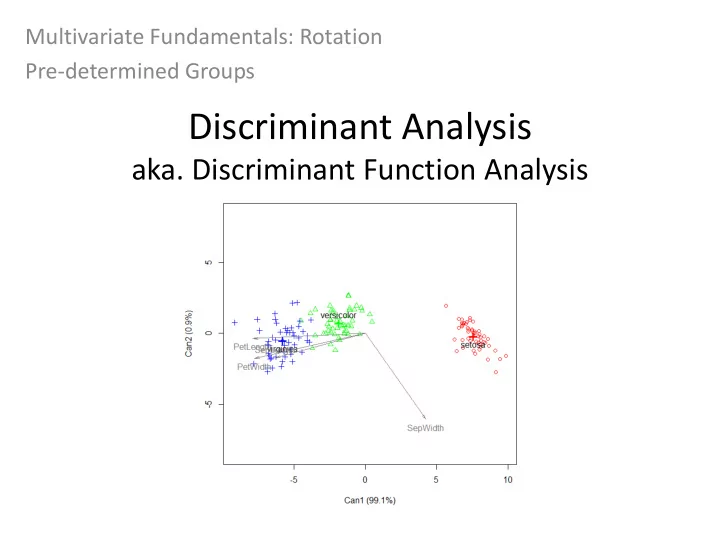
Multivariate Fundamentals: Rotation Pre-determined Groups Discriminant Analysis aka. Discriminant Function Analysis Discriminant Analysis (DISCRIM) Analysis for pre-determined groups Objective - Rotate that data so that variation between groups
Think of DISCRIM as: “How far can I separate known groups given measurements of several variables on individuals within these groups” “What distinguishes my groups?” Sir Ronald Fisher (1890-1962) NOT average group measurements Measurements on individuals within the pre-determined groups
Linear discriminant (column vector) Column vectors of original variables
a, b,… z Coefficients for linear model
DISCRIM in R:
library(MASS)
Need to install MASS package to run discriminant analysis Either MASS or candisk Column of pre-determined groups Dataset for analysis You need to define which variables to include in the analysis
DISCRIM in R:
library(candisc) x=lm(cbind(predictors)~Groups, data)
For candisc you first need to generate a linear regression model of predictors with Group variable as your response variable (function lm), then run candisc for DISCRIM
Proportion of variance explained by linear discriminants Mean observation values for variables in each pre-defined group The initial probability of belonging to a group
(more important for predicting class)
Coefficients of linear discriminants are the solutions to our linear functions MASS will only display solutions for the most significant linear discriminants Discriminants that explain very small portion of the variance are removed
Proportion of variance explained by linear discriminants Mean discriminant values for each pre- defined group Standard error of the means are also given By querying the analysis structure we can see the discriminant loadings which tell us the relationship between the DF values and the
Again candisc will only display solutions for discriminants that explain the most variation Less information is displayed in the candisc output, but you can get the loadings which are important! Candisc also produces a nicer plot (you will be able to compare outputs in Lab 4)
Problem: A new skull is found but we don’t know whether it belongs to homo erectus or homo habilis or if it’s a new group?
Homo erectus Homo habilis Group centroid New find (unknown origin)
Skull measurement
New groups are defined when we find a significant difference between new find and predefined groups
Popular method in taxonomy and anthropology