
Excel2013: Model Logistic MLE 1Y1X Sept 2015 V1A Excel2013-Model-Logistic-MLE-1Y1X-Slides.pdf 1
Excel2013 Model Logistic MLE 1Y1X SlidesV1A 1
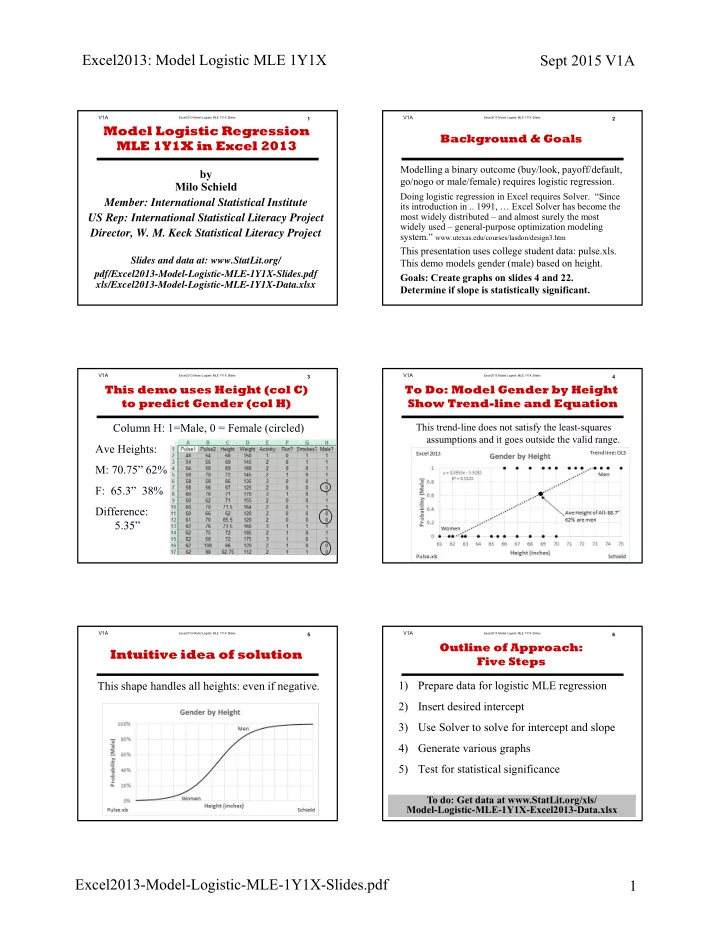
by Milo Schield Member: International Statistical Institute US Rep: International Statistical Literacy Project Director, W. M. Keck Statistical Literacy Project
Slides and data at: www.StatLit.org/ pdf/Excel2013-Model-Logistic-MLE-1Y1X-Slides.pdf xls/Excel2013-Model-Logistic-MLE-1Y1X-Data.xlsx
Model Logistic Regression MLE 1Y1X in Excel 2013
Excel2013 Model Logistic MLE 1Y1X SlidesV1A 2
Background & Goals
Modelling a binary outcome (buy/look, payoff/default, go/nogo or male/female) requires logistic regression.
Doing logistic regression in Excel requires Solver. “Since its introduction in .. 1991, … Excel Solver has become the most widely distributed – and almost surely the most widely used – general-purpose optimization modeling system.” www.utexas.edu/courses/lasdon/design3.htm
This presentation uses college student data: pulse.xls. This demo models gender (male) based on height. Goals: Create graphs on slides 4 and 22. Determine if slope is statistically significant.
Excel2013 Model Logistic MLE 1Y1X SlidesV1A
Column H: 1=Male, 0 = Female (circled) Ave Heights: M: 70.75” 62% F: 65.3” 38% Difference: 5.35”
3
This demo uses Height (col C) to predict Gender (col H)
Excel2013 Model Logistic MLE 1Y1X SlidesV1A 4
To Do: Model Gender by Height Show Trend-line and Equation
This trend-line does not satisfy the least-squares assumptions and it goes outside the valid range. but it does pass through the joint mean.
Excel2013 Model Logistic MLE 1Y1X SlidesV1A 5
Intuitive idea of solution
This shape handles all heights: even if negative.
Excel2013 Model Logistic MLE 1Y1X SlidesV1A
1) Prepare data for logistic MLE regression 2) Insert desired intercept 3) Use Solver to solve for intercept and slope 4) Generate various graphs 5) Test for statistical significance
6
Outline of Approach: Five Steps
To do: Get data at www.StatLit.org/xls/ Model-Logistic-MLE-1Y1X-Excel2013-Data.xlsx