
XL4A: Logistic Model using OLS1A in Excel 2013 1 Mar 2017 V0E 2x 2015-Schield-Logistic-OLS1A-Excel2013-Slides.pdf 1
2015 Schield Logistic Regression using OLS1A in Excel2013XL4A: V0E2x 1
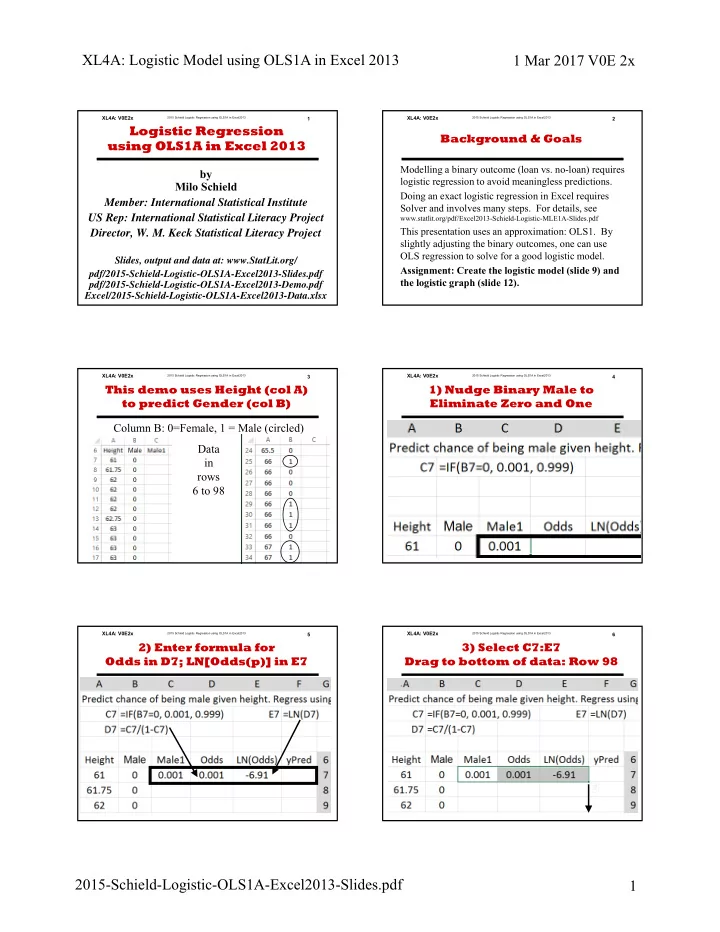
by Milo Schield Member: International Statistical Institute US Rep: International Statistical Literacy Project Director, W. M. Keck Statistical Literacy Project
Slides, output and data at: www.StatLit.org/ pdf/2015-Schield-Logistic-OLS1A-Excel2013-Slides.pdf pdf/2015-Schield-Logistic-OLS1A-Excel2013-Demo.pdf Excel/2015-Schield-Logistic-OLS1A-Excel2013-Data.xlsx
Logistic Regression using OLS1A in Excel 2013
2015 Schield Logistic Regression using OLS1A in Excel2013XL4A: V0E2x 2
Background & Goals
Modelling a binary outcome (loan vs. no-loan) requires logistic regression to avoid meaningless predictions. Doing an exact logistic regression in Excel requires Solver and involves many steps. For details, see
www.statlit.org/pdf/Excel2013-Schield-Logistic-MLE1A-Slides.pdf
This presentation uses an approximation: OLS1. By slightly adjusting the binary outcomes, one can use OLS regression to solve for a good logistic model. Assignment: Create the logistic model (slide 9) and the logistic graph (slide 12).
2015 Schield Logistic Regression using OLS1A in Excel2013XL4A: V0E2x
Column B: 0=Female, 1 = Male (circled) Data in rows 6 to 98
3
This demo uses Height (col A) to predict Gender (col B)
2015 Schield Logistic Regression using OLS1A in Excel2013XL4A: V0E2x
.
4
1) Nudge Binary Male to Eliminate Zero and One
2015 Schield Logistic Regression using OLS1A in Excel2013XL4A: V0E2x
.
5
2) Enter formula for Odds in D7; LN[Odds(p)] in E7
2015 Schield Logistic Regression using OLS1A in Excel2013XL4A: V0E2x 6
3) Select C7:E7 Drag to bottom of data: Row 98
.