
Linear Model using Excel 2013 Trendline XL2A 4/3/2017 V0L www.StatLit.org/pdf/Excel2013-Model-Trendline-Linear-Slides.pdf 1
Model Trendline Linear Excel 2013 XL2A V0L1
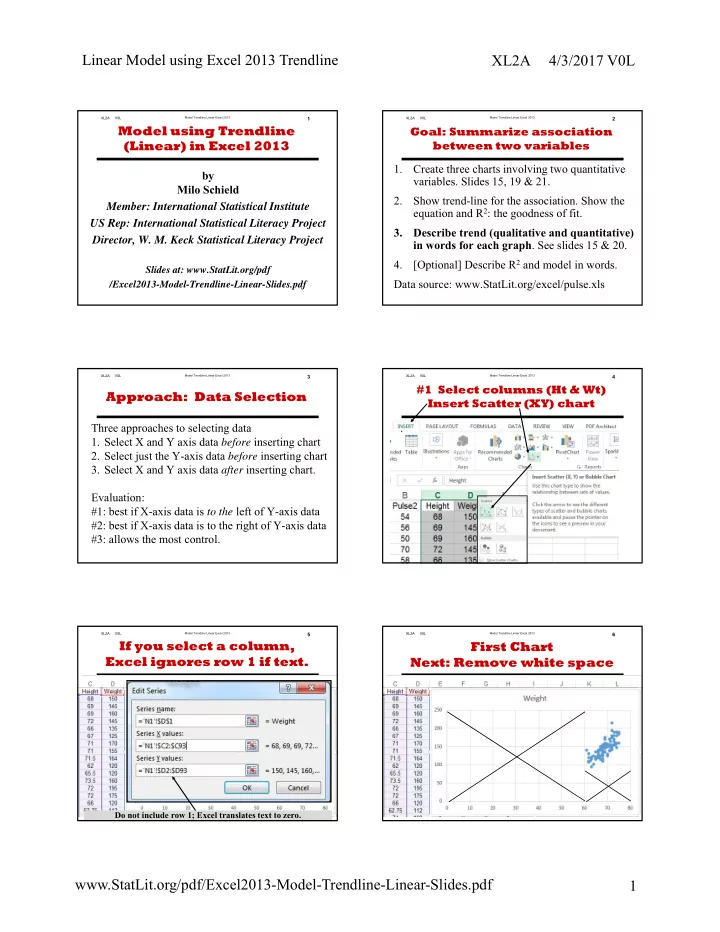
by Milo Schield Member: International Statistical Institute US Rep: International Statistical Literacy Project Director, W. M. Keck Statistical Literacy Project
Slides at: www.StatLit.org/pdf /Excel2013-Model-Trendline-Linear-Slides.pdf
Model using Trendline (Linear) in Excel 2013
Model Trendline Linear Excel 2013 XL2A V0L2
Goal: Summarize association between two variables 1. Create three charts involving two quantitative
- variables. Slides 15, 19 & 21.
2. Show trend-line for the association. Show the equation and R2: the goodness of fit. 3. Describe trend (qualitative and quantitative) in words for each graph. See slides 15 & 20. 4. [Optional] Describe R2 and model in words. Data source: www.StatLit.org/excel/pulse.xls
Model Trendline Linear Excel 2013 XL2A V0L3
Approach: Data Selection
Three approaches to selecting data
- 1. Select X and Y axis data before inserting chart
- 2. Select just the Y-axis data before inserting chart
- 3. Select X and Y axis data after inserting chart.
Evaluation: #1: best if X-axis data is to the left of Y-axis data #2: best if X-axis data is to the right of Y-axis data #3: allows the most control.
Model Trendline Linear Excel 2013 XL2A V0L4
#1 Select columns (Ht & Wt) Insert Scatter (XY) chart .
Model Trendline Linear Excel 2013 XL2A V0L5
If you select a column, Excel ignores row 1 if text.
Do not include row 1; Excel translates text to zero.
Model Trendline Linear Excel 2013 XL2A V0L6
First Chart Next: Remove white space