
XL1F: Create Histogram using HISTOGRAM in Excel 2013 V0G
www.StatLit.org/pdf/Excel2013-Create-Histogram-using-HISTOGRAM-Slides.pdf
1
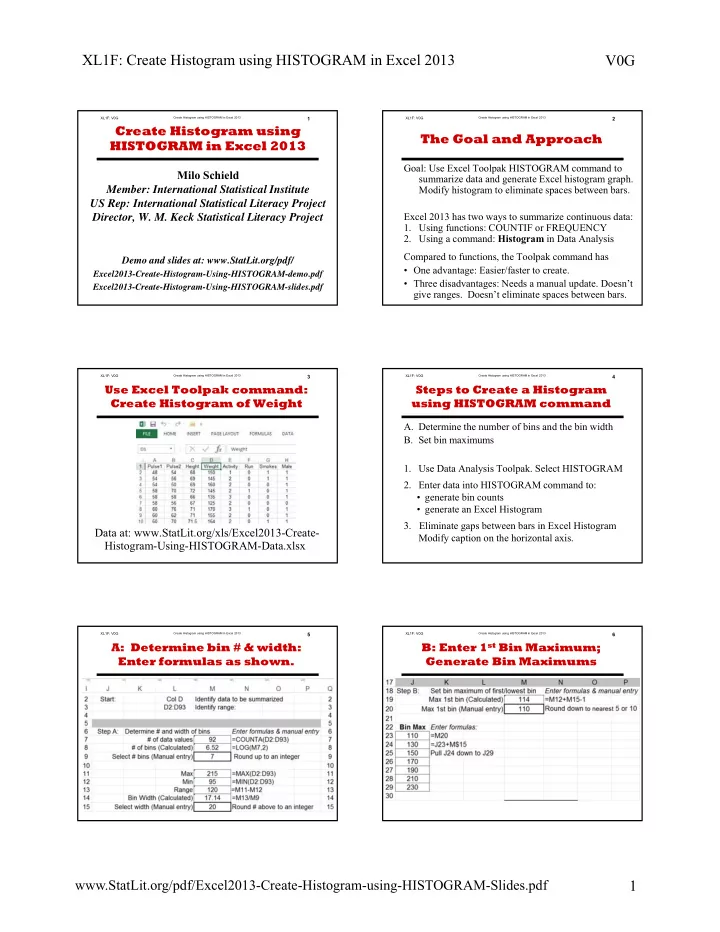
Create Histogram using HISTOGRAM in Excel 2013 XL1F: V0G1
Milo Schield Member: International Statistical Institute US Rep: International Statistical Literacy Project Director, W. M. Keck Statistical Literacy Project
Demo and slides at: www.StatLit.org/pdf/
Excel2013-Create-Histogram-Using-HISTOGRAM-demo.pdf Excel2013-Create-Histogram-Using-HISTOGRAM-slides.pdf
Create Histogram using HISTOGRAM in Excel 2013
Create Histogram using HISTOGRAM in Excel 2013 XL1F: V0G2
The Goal and Approach
Goal: Use Excel Toolpak HISTOGRAM command to summarize data and generate Excel histogram graph. Modify histogram to eliminate spaces between bars. Excel 2013 has two ways to summarize continuous data:
- 1. Using functions: COUNTIF or FREQUENCY
- 2. Using a command: Histogram in Data Analysis
Compared to functions, the Toolpak command has
- One advantage: Easier/faster to create.
- Three disadvantages: Needs a manual update. Doesn’t
give ranges. Doesn’t eliminate spaces between bars.
Create Histogram using HISTOGRAM in Excel 2013 XL1F: V0G3
Use Excel Toolpak command: Create Histogram of Weight Data at: www.StatLit.org/xls/Excel2013-Create- Histogram-Using-HISTOGRAM-Data.xlsx
Create Histogram using HISTOGRAM in Excel 2013 XL1F: V0G4
Steps to Create a Histogram using HISTOGRAM command
- A. Determine the number of bins and the bin width
- B. Set bin maximums
- 1. Use Data Analysis Toolpak. Select HISTOGRAM
- 2. Enter data into HISTOGRAM command to:
- generate bin counts
- generate an Excel Histogram
- 3. Eliminate gaps between bars in Excel Histogram
Modify caption on the horizontal axis.
Create Histogram using HISTOGRAM in Excel 2013 XL1F: V0G5
A: Determine bin # & width: Enter formulas as shown. .
Create Histogram using HISTOGRAM in Excel 2013 XL1F: V0G6
B: Enter 1st Bin Maximum; Generate Bin Maximums