
Creating Confidence Intervals using Excel 2010 5/08/2015 V0M www.StatLit.org/pdf/Create-Confidence-Intervals-Excel2010-slides.pdf 1
Create Confidence Intervals using Excel 2010V0M 1
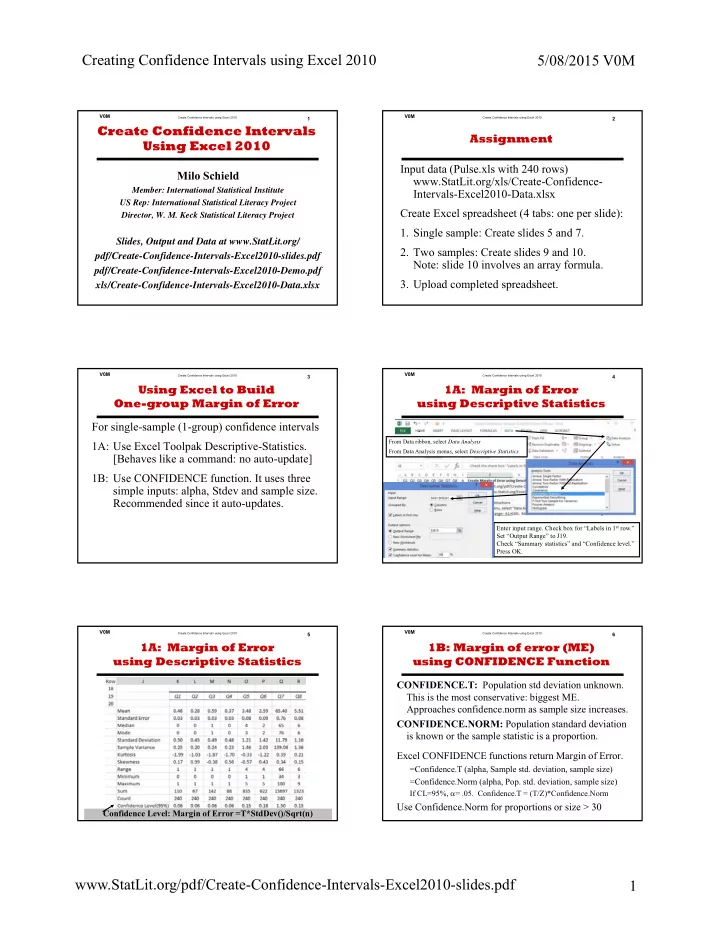
Milo Schield
Member: International Statistical Institute US Rep: International Statistical Literacy Project Director, W. M. Keck Statistical Literacy Project
Slides, Output and Data at www.StatLit.org/ pdf/Create-Confidence-Intervals-Excel2010-slides.pdf pdf/Create-Confidence-Intervals-Excel2010-Demo.pdf xls/Create-Confidence-Intervals-Excel2010-Data.xlsx
Create Confidence Intervals Using Excel 2010
Create Confidence Intervals using Excel 2010V0M 2
Assignment Input data (Pulse.xls with 240 rows) www.StatLit.org/xls/Create-Confidence- Intervals-Excel2010-Data.xlsx Create Excel spreadsheet (4 tabs: one per slide):
- 1. Single sample: Create slides 5 and 7.
- 2. Two samples: Create slides 9 and 10.
Note: slide 10 involves an array formula.
- 3. Upload completed spreadsheet.
V0M 3
Using Excel to Build One-group Margin of Error For single-sample (1-group) confidence intervals 1A: Use Excel Toolpak Descriptive-Statistics. [Behaves like a command: no auto-update] 1B: Use CONFIDENCE function. It uses three simple inputs: alpha, Stdev and sample size. Recommended since it auto-updates.
Create Confidence Intervals using Excel 2010V0M
.
Enter input range. Check box for “Labels in 1st row.” Set “Output Range” to J19. Check “Summary statistics” and “Confidence level.” Press OK.
4
1A: Margin of Error using Descriptive Statistics
From Data ribbon, select Data Analysis From Data Analysis menus, select Descriptive Statistics.
Create Confidence Intervals using Excel 2010V0M 5
1A: Margin of Error using Descriptive Statistics
Confidence Level: Margin of Error =T*StdDev()/Sqrt(n)
Create Confidence Intervals using Excel 2010V0M 6
1B: Margin of error (ME) using CONFIDENCE Function
CONFIDENCE.T: Population std deviation unknown. This is the most conservative: biggest ME. Approaches confidence.norm as sample size increases. CONFIDENCE.NORM: Population standard deviation is known or the sample statistic is a proportion. Excel CONFIDENCE functions return Margin of Error.
=Confidence.T (alpha, Sample std. deviation, sample size) =Confidence.Norm (alpha, Pop. std. deviation, sample size)
If CL=95%, = .05. Confidence.T = (T/Z)*Confidence.Norm
Use Confidence.Norm for proportions or size > 30