
Create Pivot Tables using Excel 2008/2013 1/26/2016 V1H 1 Create-Pivot-Tables-Excel-2008-6up.pdf
V1H
Create Pivot Tables using Excel 20081
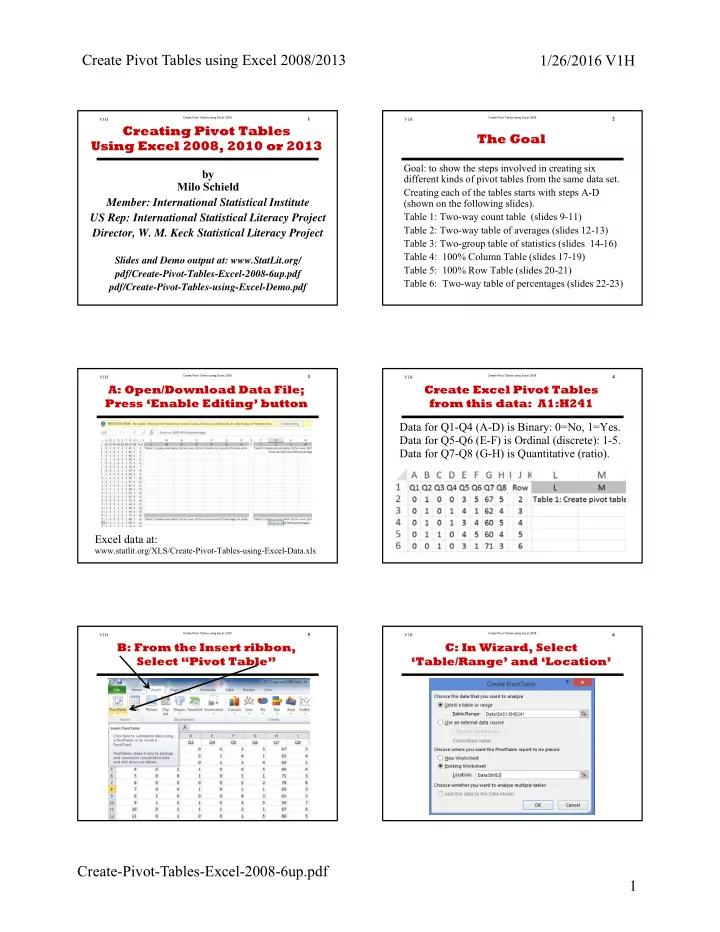
by Milo Schield Member: International Statistical Institute US Rep: International Statistical Literacy Project Director, W. M. Keck Statistical Literacy Project
Slides and Demo output at: www.StatLit.org/ pdf/Create-Pivot-Tables-Excel-2008-6up.pdf pdf/Create-Pivot-Tables-using-Excel-Demo.pdf
Creating Pivot Tables Using Excel 2008, 2010 or 2013
V1H
Create Pivot Tables using Excel 20082
The Goal
Goal: to show the steps involved in creating six different kinds of pivot tables from the same data set. Creating each of the tables starts with steps A-D (shown on the following slides). Table 1: Two-way count table (slides 9-11) Table 2: Two-way table of averages (slides 12-13) Table 3: Two-group table of statistics (slides 14-16) Table 4: 100% Column Table (slides 17-19) Table 5: 100% Row Table (slides 20-21) Table 6: Two-way table of percentages (slides 22-23)
V1H
Create Pivot Tables using Excel 20083
A: Open/Download Data File; Press ‘Enable Editing’ button Excel data at:
www.statlit.org/XLS/Create-Pivot-Tables-using-Excel-Data.xls
V1H
Create Pivot Tables using Excel 20084
Create Excel Pivot Tables from this data: A1:H241 Data for Q1-Q4 (A-D) is Binary: 0=No, 1=Yes. Data for Q5-Q6 (E-F) is Ordinal (discrete): 1-5. Data for Q7-Q8 (G-H) is Quantitative (ratio).
V1H
Create Pivot Tables using Excel 20085
B: From the Insert ribbon, Select “Pivot Table” .
V1H
Create Pivot Tables using Excel 20086
C: In Wizard, Select ‘Table/Range’ and ‘Location’
.