hypothesis tests using excel t test function v1e 11 12
play

Hypothesis Tests using Excel T.TEST function V1e 11/12/2013 Two - PDF document

Hypothesis Tests using Excel T.TEST function V1e 11/12/2013 Two group hypothesis tests using Excel T.TEST Two group hypothesis tests using Excel T.TEST 1 2 Two-Group Hypothesis Tests Excel T.TEST Function Using Excel T.TEST Function


  1. Hypothesis Tests using Excel T.TEST function V1e 11/12/2013 Two group hypothesis tests using Excel T.TEST Two group hypothesis tests using Excel T.TEST 1 2 Two-Group Hypothesis Tests Excel T.TEST Function Using Excel T.TEST Function Purpose: Calculate likelihood (p-value) of getting the observed by difference in two sample means (or more extreme) by chance Milo Schield in random samples – assuming there is no difference in the two population means (the Null Hypothesis). Member: International Statistical Institute Note: TTEST function was available in Excel 2003. US Rep: International Statistical Literacy Project Four Inputs: Director, W. M. Keck Statistical Literacy Project 1) Array or range of 1 st sample. 2) Array or range of 2 nd sample. 3) Tails: 1 (Excel matches Alternate with sample means) or 2. Slides and audio at: www.StatLit.org/ 4) Type of T.TEST. 1 dependent, matched subjects. pdf/TTEST-Function-Excel-2008-6up.pdf 2: population variances unknown but equal. [Often true] Audio/TTEST-Function-Excel-2008.mp3 3: population variances unknown & unequal. [Conservative] Two group hypothesis tests using Excel T.TEST 3 Two group hypothesis tests using Excel T.TEST 4 Run Hypothesis Tests Approach from this data: B1:I241 Excel’s two-population T-Test function requires that the Data for Q1-Q4 (B-E) is Binary: 0=No, 1=Yes. data be “stacked” (separated into two groups) by the value Data for Q5-Q6 (F-G) is Ordinal (discrete): 1-5. of the predictor. Predictor must be binary. Data for Q7-Q8 (H-I) is Quantitative (ratio). If the binary predictor is the answer to Q1, then the entire data set must be sorted by Q1. The Excel “Sort” requires that the entire data set be selected before invoking the sort command. A common mistake is to sort just a single column rather than the entire dataset. Unfortunately Excel does not have a “stacked” or Excel instructions and data at: conditional T-Test function. T-Test function will www.StatLit.org/xls/2012Isaacson240Data.xls automatically update p-values if data is re-sorted. Two group hypothesis tests using Excel T.TEST 5 Two group hypothesis tests using Excel T.TEST 6 A: Select data!! From the B: In Sort dialogue box, Home or Data tab, select Sort select Sort Column by “Q1” . . Note: Q1 is used as an example. Any field with binary data can be used. www.StatLit.org/pdf/TTEST-Function-Excel-2008-6up.pdf 1

  2. Hypothesis Tests using Excel T.TEST function V1e 11/12/2013 Two group hypothesis tests using Excel T.TEST Two group hypothesis tests using Excel T.TEST 7 8 C: Q2 for Q1=0 from C2 to C131. D: Place cursor for results. Q2 for Q1=1 from C132 to C241. From Statistical , select T.TEST . . All Excel hypothesis tests require the data to be stacked: one group on top of the other . After sort on binary data in column B (Q1), data in columns C through I (Q2-Q8) is stacked . Group 1 in rows 2-131 have Q1=0; Group 2 in rows 132-241 have Q1=1. Note: Excel will run a T.TEST on any numerical data. Running a T.TEST on ordinal or binary data treats numbers as quantitative data. Binary data should be coded as 0 or 1. Two group hypothesis tests using Excel T.TEST 9 Two group hypothesis tests using Excel T.TEST 10 T.TEST Procedure 1-3) Insert T.Test Function Given Stacked Data 1: Place cursor where T.TEST p-value will be recorded. Locate this cell in a different place for each new test. Label the cell to reflect the T.TEST inputs. E.g., Q2 by Q1. 2: Insert T.TEST in Excel 2008 or newer (TTEST in 2003): Test for a two-group difference in Means (Measures) or in Proportions (Counts) 3: Enter appropriate data or cell references for the T.TEST function arguments. See examples on following slides. 4: T.TEST will change if data is resorted. Three solutions: A) Put data from each sort in a separate tab. Insert T.TEST function in cell L7. B) Copy sorted data to a separate place on one worksheet. Enter four arguments: Array1, Array2, Tails and Type. C) Copy & Paste/Special/Values with appropriate labeling. Two group hypothesis tests using Excel T.TEST 11 Two group hypothesis tests using Excel T.TEST 12 3a) T.Test for Proportions: 3b) T.Test for Proportions: Results for Q2 by Q1 Results for Q3 by Q1 27% vs. 29% 78% vs. 36% In decimal notation, this is 0.000 000 000 002 424 79 E-12: the decimal point is moved 12 places to the left! One-tailed P-value is 0.36; Fail to reject the Null. One-tailed P-value is 2.4 E-12; Reject the Null! Difference in Q2 by Q1 is “not statistically significant” Difference in Q3 by Q1 is ‘statistically significant’. www.StatLit.org/pdf/TTEST-Function-Excel-2008-6up.pdf 2

  3. Hypothesis Tests using Excel T.TEST function V1e 11/12/2013 Two group hypothesis tests using Excel T.TEST Two group hypothesis tests using Excel T.TEST 13 14 3c) T.Test for Proportions: 3d) T.Test for Measures: Results for Q4 by Q1 Results for Q5 by Q1 35% vs. 39% 3.02 vs. 4.03 One-tailed P-value is 0.24; Fail to reject the Null. One tailed P-value is 6.5E-12; Reject the Null . Difference in Q4 by Q1 is “not statistically significant” Difference in Q5 by Q1 is “statistically significant”. Two group hypothesis tests using Excel T.TEST 15 Two group hypothesis tests using Excel T.TEST 16 3e) T.Test for Measures: 3f) T.Test for Measures: Results for Q6 by Q1 Results for Q7 by Q1 66.38 vs. 64.25 2.59 vs. 2.59 One tailed P-value is 0.50; Fail to reject the Null. One tailed P-value is 0.08; Fail to reject the Null. Difference in Q6 by Q1 is “not statistically significant” Difference in Q7 by Q1 is “not statistically significant” Two group hypothesis tests using Excel T.TEST 17 Two group hypothesis tests using Excel T.TEST 18 3g) T.Test for Measures: 3h) T.TEST Results: Results for Q8 by Q1 All fields by Q1 5.50 vs. 5.53 One tailed P-value is 0.43; Fail to reject the Null. Pooled Std. Dev. = Sqrt(((n1-1)S1^2 + (n2-1)S2^2)/(n1+n2 - 2)) Difference in Q8 by Q1 is ‘not statistically significant’ Effect size = Difference in Means / Pooled Std. Deviation www.StatLit.org/pdf/TTEST-Function-Excel-2008-6up.pdf 3

  4. Hypothesis Tests using Excel T.TEST function V1e 11/12/2013 Two group hypothesis tests using Excel T.TEST Two group hypothesis tests using Excel T.TEST 19 20 T.TEST Procedure: Step 4 4A) Separate tabs for each sort . T.TEST function will change if the data is resorted. There are three solutions: 4A) Put data from each sort in a separate tab. 4B) Copy sorted data to separate places on one sheet. 4C) Copy & Paste/Special/Values with good labels. 4C is not recommended since there is no clear audit trail. In a one-tailed test, the T.TEST always tests whether the larger statistic is bigger than the smaller. Two group hypothesis tests using Excel T.TEST 21 Two group hypothesis tests using Excel T.TEST 22 4B) Separate Sorts on 1 sheet 4C) Copy; Paste-Special-Values . . Q2|Q1=1: This is statistical algebra. The vertical bar stands for “given”. Q2|Q1=1 stands for the values of Q2 when (given that) Q1 is 1. No audit trail; not recommended. Two group hypothesis tests using Excel T.TEST 23 Two group hypothesis tests using Excel T.TEST 24 Summary Other Options In a one-tailed test, T.TEST always tests whether the In testing sample statistics from two groups for statistical significance, Excel provides two other methods: positive difference between the larger sample statistic • the t-test command in the Data Analysis Toolpak, and and the smaller is statistically-significant. • combinations of basic Excel Functions. “Reject the null hypothesis” and “Failure to reject the The t-test command has the clearest documentation (audit null hypothesis” are technical conclusions. trail). All Excel methods require the two-group data be in contiguous blocks. “A difference or change IS [or IS NOT] statistically See statistics textbooks for more on differences between significant” is a non-technical conclusion. paired or matched subjects. Examples include before-after Use the non-technical expressions for everyday differences on the same subjects, husband-wife differences, communication. and differences in two appraisals of the same houses. www.StatLit.org/pdf/TTEST-Function-Excel-2008-6up.pdf 4

  5. Two group hypothesis tests using Excel T.TEST 1 Two-Group Hypothesis Tests Using Excel T.TEST Function 
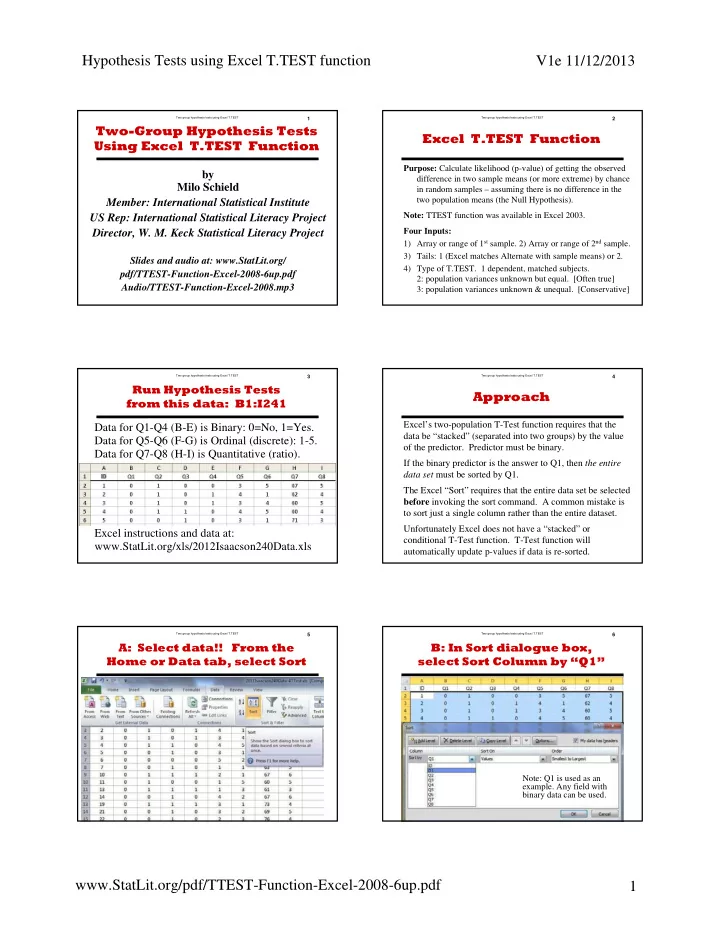
by Milo Schield Member: International Statistical Institute US Rep: International Statistical Literacy Project Director, W. M. Keck Statistical Literacy Project Slides and audio at: www.StatLit.org/ pdf/TTEST-Function-Excel-2008-6up.pdf Audio/TTEST-Function-Excel-2008.mp3

  6. Two group hypothesis tests using Excel T.TEST 2 Excel T.TEST Function Purpose: Calculate likelihood (p-value) of getting the observed difference in two sample means (or more extreme) by chance in random samples – assuming there is no difference in the two population means (the Null Hypothesis). Note: TTEST function was available in Excel 2003. Four Inputs: 1) Array or range of 1 st sample. 2) Array or range of 2 nd sample. 3) Tails: 1 (Excel matches Alternate with sample means) or 2. 4) Type of T.TEST. 1 dependent, matched subjects. 2: population variances unknown but equal. [Often true] 3: population variances unknown & unequal. [Conservative]

  7. Two group hypothesis tests using Excel T.TEST 3 Run Hypothesis Tests from this data: B1:I241 Data for Q1-Q4 (B-E) is Binary: 0=No, 1=Yes. Data for Q5-Q6 (F-G) is Ordinal (discrete): 1-5. Data for Q7-Q8 (H-I) is Quantitative (ratio). Excel instructions and data at: www.StatLit.org/xls/2012Isaacson240Data.xls

Download Presentation
Download Policy: The content available on the website is offered to you 'AS IS' for your personal information and use only. It cannot be commercialized, licensed, or distributed on other websites without prior consent from the author. To download a presentation, simply click this link. If you encounter any difficulties during the download process, it's possible that the publisher has removed the file from their server.

Recommend


More recommend