
Hypothesis Tests using Z.TEST function in Excel 2008 V1c 11/16/2012 www.StatLit.org/pdf/ZTEST-Function-Excel-2008-6up.pdf 1
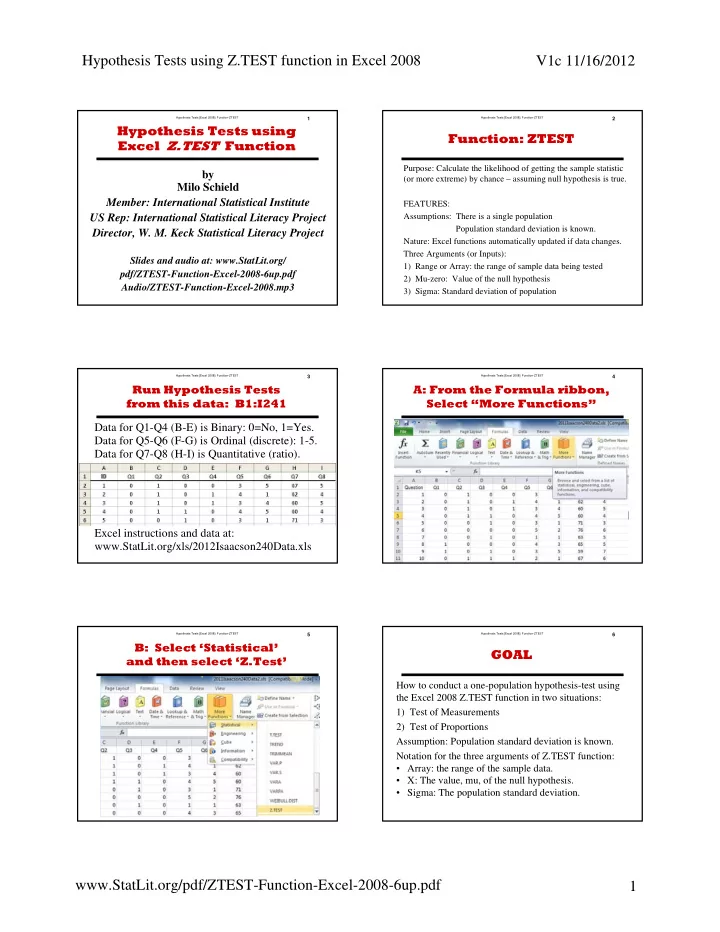
Hypothesis Tests [Excel 2008]: Function-ZTEST1
by Milo Schield Member: International Statistical Institute US Rep: International Statistical Literacy Project Director, W. M. Keck Statistical Literacy Project
Slides and audio at: www.StatLit.org/ pdf/ZTEST-Function-Excel-2008-6up.pdf Audio/ZTEST-Function-Excel-2008.mp3
Hypothesis Tests using Excel Z.TEST Function
Hypothesis Tests [Excel 2008]: Function-ZTEST2
Function: ZTEST
Purpose: Calculate the likelihood of getting the sample statistic (or more extreme) by chance – assuming null hypothesis is true. FEATURES: Assumptions: There is a single population Population standard deviation is known. Nature: Excel functions automatically updated if data changes. Three Arguments (or Inputs): 1) Range or Array: the range of sample data being tested 2) Mu-zero: Value of the null hypothesis 3) Sigma: Standard deviation of population
Hypothesis Tests [Excel 2008]: Function-ZTEST3
Run Hypothesis Tests from this data: B1:I241 Data for Q1-Q4 (B-E) is Binary: 0=No, 1=Yes. Data for Q5-Q6 (F-G) is Ordinal (discrete): 1-5. Data for Q7-Q8 (H-I) is Quantitative (ratio). Excel instructions and data at: www.StatLit.org/xls/2012Isaacson240Data.xls
Hypothesis Tests [Excel 2008]: Function-ZTEST4
A: From the Formula ribbon, Select “More Functions” .
Hypothesis Tests [Excel 2008]: Function-ZTEST5
B: Select ‘Statistical’ and then select ‘Z.Test’ .
Hypothesis Tests [Excel 2008]: Function-ZTEST6
GOAL
How to conduct a one-population hypothesis-test using the Excel 2008 Z.TEST function in two situations: 1) Test of Measurements 2) Test of Proportions Assumption: Population standard deviation is known. Notation for the three arguments of Z.TEST function:
- Array: the range of the sample data.
- X: The value, mu, of the null hypothesis.
- Sigma: The population standard deviation.