cases of covid 19 per 100 000 population for select races
play

Cases of COVID-19 per 100,000 Population for Select - PowerPoint PPT Presentation

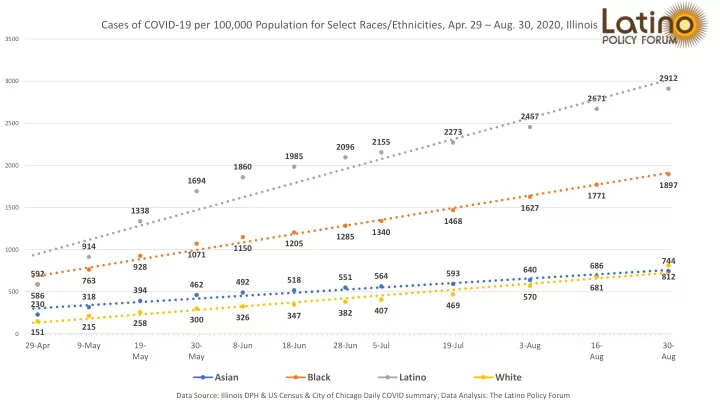
Cases of COVID-19 per 100,000 Population for Select Races/Ethnicities, Apr. 29 Aug. 30, 2020, Illinois 3500 2912 3000 2671 2457 2500 2273 2155 2096 1985 2000 1860 1694 1897 1771 1627 1500 1338 1468 1340 1285 1205 914 1150


  1. Cases of COVID-19 per 100,000 Population for Select Races/Ethnicities, Apr. 29 – Aug. 30, 2020, Illinois 3500 2912 3000 2671 2457 2500 2273 2155 2096 1985 2000 1860 1694 1897 1771 1627 1500 1338 1468 1340 1285 1205 914 1150 1000 1071 744 686 928 640 592 593 564 812 551 518 763 492 462 681 394 500 586 318 570 230 469 407 382 347 326 300 258 215 151 0 29-Apr 9-May 19- 30- 8-Jun 18-Jun 28-Jun 5-Jul 19-Jul 3-Aug 16- 30- May May Aug Aug Asian Black Latino White Data Source: Illinois DPH & US Census & City of Chicago Daily COVID summary; Data Analysis: The Latino Policy Forum

  2. Cases of COVID-19 per 100,000 Population for Select Races/Ethnicities, Aug. 30, 2020, Illinois 3500 2912 3000 2500 1897 2000 1500 1000 812 744 500 0 Asian Black Latino White Data Source: Illinois DPH & US Census & City of Chicago Daily COVID summary; Data Analysis: The Latino Policy Forum

Download Presentation
Download Policy: The content available on the website is offered to you 'AS IS' for your personal information and use only. It cannot be commercialized, licensed, or distributed on other websites without prior consent from the author. To download a presentation, simply click this link. If you encounter any difficulties during the download process, it's possible that the publisher has removed the file from their server.

Recommend


More recommend