SLIDE 1
Data Source: IDPH, The US Census, Illinois Latino COVID-19 Initiative; Data Analysis: The Latino Policy Forum
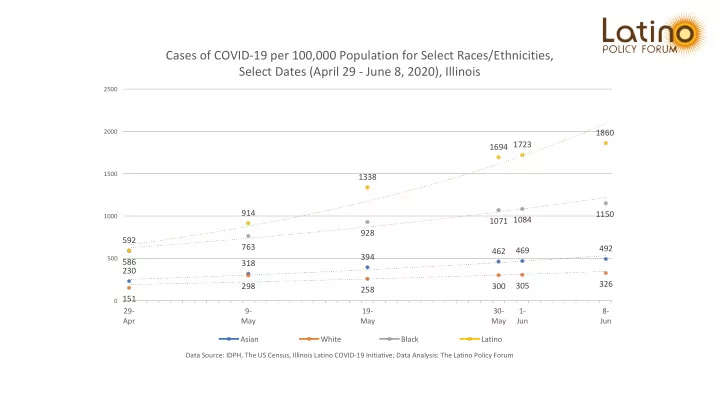
29- Apr 9- May 19- May 30- May 1- Jun 8- Jun
500 1000 1500 2000 2500
230 318 394 462 469 492 151 298 258 300 305 326 586 763 928 1071 1084 1150 592 914 1338 1694 1723 1860
Cases of COVID-19 per 100,000 Population for Select Races/Ethnicities, Select Dates (April 29 - June 8, 2020), Illinois
Asian White Black Latino
SLIDE 2
Data Source: IDPH, The US Census (July 2019), Illinois Latino COVID-19 Initiative
Asian White Black Latino State
200 400 600 800 1000 1200 1400 1600 1800 2000
492 326 1150 1860 1008
Cases of COVID-19 per 100,000 Population for Select Races/Ethnicities, June 8, 2020, Illinois
SLIDE 3
*11 of 15 IL zip codes/geographi c locales with most cases per 100,000 have majority-Latino populations.
Data source for zip codes/geographic locales: Orestes Aguillon, Latin American Matrix, June 3, 2020 Data source for population: The US Census (July 2019)
15 IL zip codes/geographic locales with most cases per 100,000 State total (June 1, 2020)
500 1000 1500 2000 2500 3000
2611 953
Cases of COVID-19 per 100,000 Population for Select Zip Codes/Geographic Locales, June 3, 2020, Illinois
SLIDE 4
SLIDE 5