World COVID-19 Situation Beginning 1/20/20 Cumulative Number of - - PowerPoint PPT Presentation

world covid 19 situation beginning 1 20 20
SMART_READER_LITE
LIVE PREVIEW

World COVID-19 Situation Beginning 1/20/20 Cumulative Number of - - PowerPoint PPT Presentation

World COVID-19 Situation Beginning 1/20/20 Cumulative Number of Confirmed Cases 25,000,000 WHO WorldoMeter 20,000,000 18,008,407 15,000,000 10,357,662 10,000,000 6,057,853 5,000,000 3,175,207 823,626 0 1 2 3 4 5 6 7 8 9 1 0


slide-1
SLIDE 1

World COVID-19 Situation Beginning 1/20/20

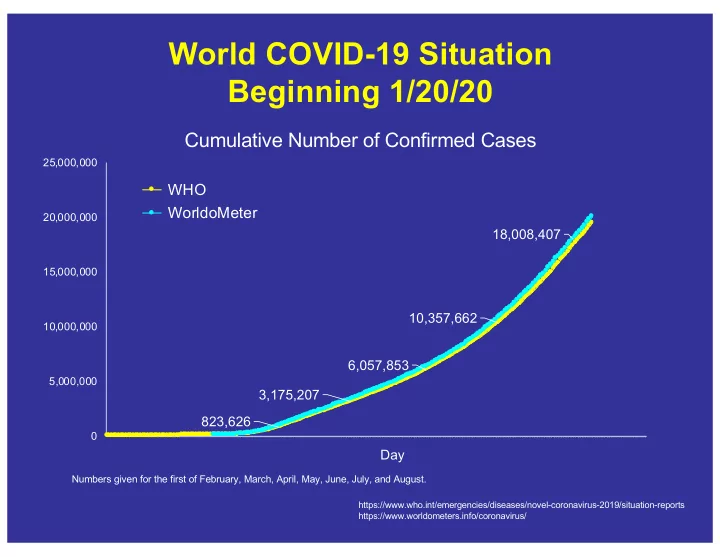
823,626 3,175,207 6,057,853 10,357,662 18,008,407

5,000,000 10,000,000 15,000,000 20,000,000 25,000,000

1 2 3 4 5 6 7 8 9 1 0 1 1 1 2 1 3 1 4 1 5 1 6 1 7 1 8 1 9 2 0 2 1 2 2 2 3 2 4 2 5 2 6 2 7 2 8 2 9 3 0 3 1 3 2 3 3 3 4 3 5 3 6 3 7 3 8 3 9 4 0 4 1 4 2 4 3 4 4 4 5 4 6 4 7 4 8 4 9 5 0 5 1 5 2 5 3 5 4 5 5 5 6 5 7 5 8 5 9 6 0 6 1 6 2 6 3 6 4 6 5 6 6 6 7 6 8 6 9 7 0 7 1 7 2 7 3 7 4 7 5 7 6 7 7 7 8 7 9 8 0 8 1 8 2 8 3 8 4 8 5 8 6 8 7 8 8 8 9 9 0 9 1 9 2 9 3 9 4 9 5 9 6 9 7 9 8 9 9 1 0 1 0 1 1 0 2 1 0 3 1 0 4 1 0 5 1 0 6 1 0 7 1 0 8 1 0 9 1 1 1 1 1 1 2 1 1 3 1 1 4 1 1 5 1 1 6 1 1 7 1 1 8 1 1 9 1 2 1 2 1 1 2 1 2 3 1 2 4 1 2 5 1 2 6 1 2 7 1 2 8 1 2 9 1 3 1 3 1 1 3 2 1 3 1 3 4 1 3 5 1 3 6 1 3 7 1 3 8 1 3 9 1 4 1 4 1 1 4 2 1 4 3 1 4 1 4 5 1 4 6 1 4 7 1 4 8 1 4 9 1 5 1 5 1 1 5 2 1 5 3 1 5 4 1 5 1 5 6 1 5 7 1 5 8 1 5 9 1 6 1 6 1 1 6 2 1 6 3 1 6 4 1 6 5 1 6 1 6 7 1 6 8 1 6 9 1 7 1 7 1 1 7 2 1 7 3 1 7 4 1 7 5 1 7 6 1 7 1 7 8 1 7 9 1 8 1 8 1 1 8 2 1 8 3 1 8 4 1 8 5 1 8 6 1 8 7 1 8 1 8 9 1 9 1 9 1 1 9 2 1 9 3 1 9 4 1 9 5 1 9 6 1 9 7 1 9 8 1 9 2 0 2 0 1 2 0 2 2 0 3 2 0 4 2 0 5 2 0 6 2 0 7 2 0 8 2 0 9 2 1 2 1 2 1 2 2 1 3 2 1 4 2 1 5 2 1 6 2 1 7 2 1 8 2 1 9 2 2 2 2 1 2 2 2 2 3 2 2 4

Cumulative Number of Confirmed Cases

WHO WorldoMeter

Day

https://www.who.int/emergencies/diseases/novel-coronavirus-2019/situation-reports https://www.worldometers.info/coronavirus/

Numbers given for the first of February, March, April, May, June, July, and August.

slide-2
SLIDE 2

World COVID-19 Situation

100,000 200,000 300,000 400,000

5 10 15 20 25 30 1 5 10 15 20 25 30 1 5 10 15 20 25 30 1 5 10 15 20 25 30 5 10 15 20 25 30 1 5 10 15 20 25 30

Number of Newly Confirmed Cases by Day

# Cases/day 7-day Running Average

March April May June July August

https://www.worldometers.info/coronavirus/

slide-3
SLIDE 3

World COVID-19 Situation Beginning 1/20/20

259 2,977 46,492 238,937 376,295 518,058 688,016

300,000 600,000 900,000

1 2 3 4 5 6 7 8 9 1 0 1 1 1 2 1 3 1 4 1 5 1 6 1 7 1 8 1 9 2 0 2 1 2 2 2 3 2 4 2 5 2 6 2 7 2 8 2 9 3 0 3 1 3 2 3 3 3 4 3 5 3 6 3 7 3 8 3 9 4 0 4 1 4 2 4 3 4 4 4 5 4 6 4 7 4 8 4 9 5 0 5 1 5 2 5 3 5 4 5 5 5 6 5 7 5 8 5 9 6 0 6 1 6 2 6 3 6 4 6 5 6 6 6 7 6 8 6 9 7 0 7 1 7 2 7 3 7 4 7 5 7 6 7 7 7 8 7 9 8 0 8 1 8 2 8 3 8 4 8 5 8 6 8 7 8 8 8 9 9 0 9 1 9 2 9 3 9 4 9 5 9 6 9 7 9 8 9 9 1 0 1 0 1 1 0 2 1 0 3 1 0 4 1 0 5 1 0 6 1 0 7 1 0 8 1 0 9 1 1 1 1 1 1 2 1 1 3 1 1 4 1 1 5 1 1 6 1 1 7 1 1 8 1 1 9 1 2 1 2 1 1 2 1 2 3 1 2 4 1 2 5 1 2 6 1 2 7 1 2 8 1 2 9 1 3 1 3 1 1 3 2 1 3 1 3 4 1 3 5 1 3 6 1 3 7 1 3 8 1 3 9 1 4 1 4 1 1 4 2 1 4 3 1 4 1 4 5 1 4 6 1 4 7 1 4 8 1 4 9 1 5 1 5 1 1 5 2 1 5 3 1 5 4 1 5 1 5 6 1 5 7 1 5 8 1 5 9 1 6 1 6 1 1 6 2 1 6 3 1 6 4 1 6 5 1 6 1 6 7 1 6 8 1 6 9 1 7 1 7 1 1 7 2 1 7 3 1 7 4 1 7 5 1 7 6 1 7 1 7 8 1 7 9 1 8 1 8 1 1 8 2 1 8 3 1 8 4 1 8 5 1 8 6 1 8 7 1 8 1 8 9 1 9 1 9 1 1 9 2 1 9 3 1 9 4 1 9 5 1 9 6 1 9 7 1 9 8 1 9 2 0 2 0 1 2 0 2 2 0 3 2 0 4 2 0 5 2 0 6 2 0 7 2 0 8 2 0 9 2 1 2 1 2 1 2 2 1 3 2 1 4 2 1 5 2 1 6 2 1 7 2 1 8 2 1 9 2 2 2 2 1 2 2 2 2 3 2 2 4

Cumulative Number of Deaths from COVID-19

WHO WorldoMeter

Day

https://www.who.int/emergencies/diseases/novel-coronavirus-2019/situation-reports https://www.worldometers.info/coronavirus/

Numbers given for the first of February, March, April, May, June, July, and August.

slide-4
SLIDE 4

World COVID-19 Situation

3,000 6,000 9,000 12,000

1 5 10 15 20 25 30 1 5 10 15 20 25 30 1 5 10 15 20 25 30 1 5 10 15 20 25 30 1 5 10 15 20 25 30 1 5 10 15 20 25 30

Number of Deaths from COVID by Day

# Deaths/Day 7-day Running Average

https://www.worldometers.info/coronavirus/

March April May June July August

slide-5
SLIDE 5

U.S. COVID-19 Situation

211,143 1,123,764 1,852,877 2,779,953 4,764,318

2,000,000 4,000,000 6,000,000

1 5 10 15 20 25 30 1 5 10 15 20 25 30 1 5 10 15 20 25 30 1 5 10 15 20 25 30 1 5 10 15 20 25 30 1 5 10 15 20 25 30

Cumulative Number of Confirmed Cases

WorldoMeter Cases-CDC

https://www.worldometers.info/coronavirus/#countries https://www.cdc.gov/coronavirus/2019-ncov/cases-in-us.html

March 5 – removed some of the restrictions on who could be tested. May 1 – many states began loosening social distancing restrictions. Numbers given for the first of April, May, June, July and August.

March April May June July August

slide-6
SLIDE 6

U.S. COVID-19 Situation

20,000 40,000 60,000 80,000 100,000

5 10 15 20 25 30 1 5 10 15 20 25 30 1 5 10 15 20 25 30 1 5 10 15 20 25 30 1 5 10 15 20 25 30 1 5 10 15 20 25 30

Number of Newly Diagnosed Cases by Day

# Cases/day 7-day Running Average

March 5 – removed some of the restrictions on who could be tested. May 1 – many states began loosening social distancing restrictions.

https://www.worldometers.info/coronavirus/#countries

March April May June July August

slide-7
SLIDE 7

6,458 66,984 108,088 130,798 157,898

50,000 100,000 150,000 200,000

1 5 10 15 20 25 30 1 5 10 15 20 25 30 1 5 10 15 20 25 30 1 5 10 15 20 25 30 1 5 10 15 20 25 30 1 5 10 15 20 25 30

Cumulative Number of Deaths from COVID-19

WorldoMeter CDC

US deaths: Korean War 36,574 Vietnam War 58,209 World War I 116,516 World War II 405,399 US deaths in WWI N = 116,516 US deaths in WWI + Korean War N = 153,090

U.S. COVID-19 Situation

May 1 – many states loosened social distancing restrictions. Numbers given for the first of April, May, June, July, and August.

https://www.worldometers.info/coronavirus/#countries https://www.cdc.gov/coronavirus/2019-ncov/cases-in-us.html

March April May June July August

slide-8
SLIDE 8

500 1,000 1,500 2,000 2,500 3,000

1 5 10 15 20 25 30 1 5 10 15 20 25 30 1 5 10 15 20 25 30 1 5 10 15 20 25 30 1 5 10 15 20 25 30 1 5 10 15 20 25 30

Number of Deaths from COVID-19 by Day

Deaths/Day 7-day Running Average

U.S. COVID-19 Situation

Numbers are from last post of the day.

https://www.worldometers.info/coronavirus/#countries

March April May June July August

slide-9
SLIDE 9

COVID-19 Situation South Dakota & Brookings County

slide-10
SLIDE 10

South Dakota COVID-19 Situation

129 2,525 5,034 6,826 8,867

3,000 6,000 9,000 12,000

1 5 10 15 20 25 30 1 5 10 15 20 25 30 1 5 10 15 20 25 30 1 5 10 15 20 25 30 1 5 10 15 20 25 30 1 5 10 15 20 25 30

Cumulative Number of Confirmed Cases

https://doh.sd.gov/news/Coronavirus.aspx

August 10th

  • 9,663 positive
  • 63 currently hospitalized
  • 882 ever hospitalized
  • 146 deaths

Numbers given for the first of April, May, June, and July. Week of May 4 – screening on Smithfield workers, families & contacts. State residents only.

March April May June July August

slide-11
SLIDE 11

South Dakota COVID-19 Situation

50 100 150 200 250

1 5 10 15 20 25 30 1 5 10 15 20 25 30 1 5 10 15 20 25 30 1 5 10 15 20 25 30 1 5 10 15 20 25 30 1 5 10 15 20 25 30

Number of Confirmed Cases by Day

# Cases/day 7-day Running Average

https://doh.sd.gov/news/Coronavirus.aspx

Mid-April: Smithfield outbreak. Week of May 4: screened Smithfield workers, families & contacts. May 28: began screenings residential care residents & health care providers

March April May June July August

slide-12
SLIDE 12

South Dakota COVID-19 Situation

Sioux Falls Area vs. Non-Sioux Falls Area

2,263 3,623 4,009 4,818 106 262 1,411 2,817 4,049

2,000 4,000 6,000

1 5 10 15 20 25 30 1 5 10 15 20 25 30 1 5 10 15 20 25 30 1 5 10 15 20 25 30 1 5 10 15 20 25 30 1 5 10 15 20 25 30

Cumulative Number of Confirmed Cases

Sioux Falls Area Non-Sioux Falls

Sioux Falls area includes Minnehaha, Lincoln, McCook & Turner counties. No data presented for 4/7/20-4/11/20. Week of May 4 – screening on Smithfield workers, families & contacts. Numbers given for the first of April, May, June, July, and August.

https://doh.sd.gov/news/Coronavirus.aspx

March April May June July August

slide-13
SLIDE 13

South Dakota COVID-19 Situation

Sioux Falls vs. Non-Sioux Falls

50 100 150 200 250

1 5 10 15 20 25 30 1 5 10 15 20 25 30 1 5 10 15 20 25 30 1 5 10 15 20 25 30 1 5 10 15 20 25 30

Number of Confirmed Cases by Location & Day

Sioux Falls Area Non-Sioux Falls Area

Mid-April: Smithfield outbreak. Week of May 4 – screening of Smithfield workers, families & contacts. Did not start recording Sioux Falls vs. Non-Sioux Falls until mid-April. Sioux Falls area includes Minnehaha, Lincoln, McCook & Turner counties.

https://doh.sd.gov/news/Coronavirus.aspx

April May June July August

slide-14
SLIDE 14

South Dakota COVID-19 Situation

Age Distribution

25 50 75 100 125

1 5 10 15 20 25 30 1 5 10 15 20 25 301 5 10 15 20 25 30 1 5 10 15 20 25 30

Number of Confirmed Cases by Age & Day

< 60 Years (75% SD ) 60+ Years (25% SD)

Started recording age distribution on May 15th. On May 15th there were 3,336 individuals < 60 years and 551 60+ years (86% and 14% of cases, respectively). Testing at nursing homes and residential care facilities began the week of May 26th.

https://doh.sd.gov/news/Coronavirus.aspx

% of cases 60+ years: Before 5/15 14% 5/16-5/31/20 18% 6/1-6/31/20 22% 7/1-7/31/20 21%

May June July August

slide-15
SLIDE 15

South Dakota COVID-19 Situation

5 10 15 20 25 30 1,000 2,000 3,000 4,000

1 5 10 15 20 25 30 1 5 10 15 20 25 30 1 5 10 15 20 25 30 1 5 10 15 20 25 30 1 5 10 15 20 25 30 1 5 10 15 20 25 30

Percent Positive Tests Number

Percentage of Positive Tests

Daily total of people tested Daily positive tests 7-day Average of % positive tests^ ^ Calculated as sum of 7-days of previous positive cases/sum of 7-days of total tests completed*100. Duplicate tests on same individual are not

  • included. DOH website included duplicates on 7/26 so daily total number & number of negative tests were not able to be determined on 7/27.

The rate of positivity provides insight into whether enough testing is being conducted. If positivity is high, it suggests that the sickest are being tested and milder or asymptomatic cases may be missed. The WHO has said that in countries that have conducted extensive testing for COVID-19, percent positive should remain at 5% or lower for at least 14 days. NOTE: interpretation of these data is complicated by restrictions on who is getting tested at any particular time.

https://doh.sd.gov/news/Coronavirus.aspx https://coronavirus.jhu.edu/testing Mid-April: Smithfield

  • utbreak

May 4-8th: Smithfield workers, families & contacts screened

May 26th: begin screening residential care residents & healthcare providers

March April May June July August

slide-16
SLIDE 16

South Dakota COVID-19 Situation

20 179 435 674 832

200 400 600 800 1,000

1 5 10 15 20 25 30 1 5 10 15 20 25 30 1 5 10 15 20 25 30 1 5 10 15 20 25 30 1 5 10 15 20 25 30 1 5 10 15 20 25 30

Cumulative Number of Hospitalizations

https://doh.sd.gov/news/Coronavirus.aspx

Numbers given for the first of April, May, June, July, and August. Includes only state residents.

March April May June July August

slide-17
SLIDE 17

South Dakota COVID-19 Situation

25 50 75 100 125

1 5 10 15 20 25 30 1 5 10 15 20 25 30 1 5 10 15 20 25 30 1 5 10 15 20 25 30 1 5 10 15 20 25 30 1 5 10 15 20 25 30

Hospitalization Data by Day

New Admissions Currently Hospitalized

No data on currently hospitalized until April 18th. Currently hospitalized includes state and out-of-state residents and transfers from other states. New admissions includes only state residents. Does not include patients on home health care.

https://doh.sd.gov/news/Coronavirus.aspx

March April May June July August

slide-18
SLIDE 18

South Dakota COVID-19 Situation

1.4 7.9 9.3 6.4 4.9

5 10 15

1 5 10 15 20 25 30 1 5 10 15 20 25 301 5 10 15 20 25 30 1 5 10 15 20 25 301 5 10 15 20 25 30 1 5 10 15 20 25 30

Running 7-day Average of New Hospitalizations by Day

Numbers given for the first of April, May, June, July and August. Includes only state residents.

https://doh.sd.gov/news/Coronavirus.aspx

March April May June July August

slide-19
SLIDE 19

South Dakota COVID-19 Situation

ICU Bed Availability

0% 20% 40% 60% 80% 100%

1 5 10 15 20 25 30 1 5 10 15 20 25 301 5 10 15 20 25 30 1 5 10 15 20 25 30

Available Non-COVID Occupied COVID-19 Occupied

Started recording ICU bed availability on May 24th. These numbers include both state and out-of-state residents and transfers from other states. ICU bed availability calculated from Hospital Available Beds for Emergencies & Disasters and the SD Electronic Disease Surveillance System.

https://doh.sd.gov/news/Coronavirus.aspx Keloland/DOH News Conference (4/17) ≅ 250 ICU beds ≅ 650 “Realistic Need” 1,300 Surge Planning

8/10/20: 23/63 hospitals provided update within last 24 hours. May June July August

slide-20
SLIDE 20

South Dakota COVID-19 Situation

Number of Active and Recovered Cases

2,000 4,000 6,000 8,000 10,000

1 5 10 15 20 25 30 1 5 10 15 20 25 30 1 5 10 15 20 25 30 1 5 10 15 20 25 30 1 5 10 15 20 25 30 1 5 10 15 20 25 30

Recovered Active Cases

Does not include number of deaths.

https://doh.sd.gov/news/Coronavirus.aspx Iceland

March April May June July August

slide-21
SLIDE 21

South Dakota COVID-19 Situation

1 21 62 93

134 50 100 150 200

1 5 10 15 20 25 30 1 5 10 15 20 25 30 1 5 10 15 20 25 30 1 5 10 15 20 25 30 1 5 10 15 20 25 30 1 5 10 15 20 25 30

Number of Deaths from COVID-19

Dept of Health does not report deaths until a certified death record is filed. By law, a death record must be filed within 5 days of the date of death. Numbers given for the first of April, May, June, July, and August.

https://doh.sd.gov/news/Coronavirus.aspx

March April May June July August Median number of SD deaths from influenza per year (2010-20) N = 32

slide-22
SLIDE 22

South Dakota COVID-19 Situation

2 4 6 8

1 5 10 15 20 25 301 5 10 15 20 25 30 1 5 10 15 20 25 301 5 10 15 20 25 30 1 5 10 15 20 25 301 5 10 15 20 25 30

Number of Deaths from COVID-19 by Day

# Deaths/day 7-day Running Average

https://doh.sd.gov/news/Coronavirus.aspx

March April May June July August

slide-23
SLIDE 23

South Dakota COVID-19 Situation

Case Fatality Rates by Age as of August 7, 2020

0.1 0.4 0.5 1.3 3.3 15.3 0.0 0.3 0.4 1.0 3.5 16.4 0.2 0.2 0.4 1.3 3.6 9.8

5 10 15 20 25

20-29 30-39 40-49 50-59 60-69 70+

Percent

Age Group

South Dakota Italy (3/17/20) China (2/11/20)

% of SD population: 13.9% 11.7% 12.9% 14.0% 9.3% 10.5%

Case fatality rate calculated at COVID deaths/(COVID deaths+recovered)*100 Data not given for ages <19 years. Data from Italy & China from: https://jamanetwork.com/journals/jama/article-abstract/2763667

slide-24
SLIDE 24

Brookings Situation

6 13 16 65 118

50 100 150

1 5 10 15 20 25 30 1 5 10 15 20 25 30 1 5 10 15 20 25 30 1 5 10 15 20 25 30 1 5 10 15 20 25 30 1 5 10 15 20 25 30

Number of Confirmed Cases of COVID-19

Numbers given for the first of April, May, June, July, and August. * Four hospitalizations were reported between 7/7-7/22/20.

https://doh.sd.gov/news/Coronavirus.aspx

August 10th

  • 139 positive cases
  • 27 active cases
  • 4 ever hospitalized*
  • 1 death

March April May June July August

slide-25
SLIDE 25

Brookings COVID-19 Situation

2 4 6 8 10

1 5 10 15 20 25 301 5 10 15 20 25 30 1 5 10 15 20 25 301 5 10 15 20 25 30 1 5 10 15 20 25 301 5 10 15 20 25 30

Number of Confirmed Cases of COVID-19 by Day

# Cases/day 7-day Running Average

https://doh.sd.gov/news/Coronavirus.aspx

Ordinance 20-005: closure of many businesses effective 3/23/20, updated 4/9/20 Ordinance 20-007: restrictions on reopening effective 5/12/20 Ordinance 20-010: similar to 20-007 (include bar servers), 2nd reading 7/7/20 5/12/20: city reopened (Ord. 20-007) 7/7/20: (Ord. 20-010) 3/23/20: many businesses closed (Ord. 20-005)

March April May June July August

slide-26
SLIDE 26

South Dakota Mobility Data via Google

  • 75
  • 25

25 75

2/15/20 2/17/20 2/19/20 2/21/20 2/23/20 2/25/20 2/27/20 2/29/20 3/2/20 3/4/20 3/6/20 3/8/20 3/10/20 3/12/20 3/14/20 3/16/20 3/18/20 3/20/20 3/22/20 3/24/20 3/26/20 3/28/20 3/30/20 4/1/20 4/3/20 4/5/20 4/7/20 4/9/20 4/11/20 4/13/20 4/15/20 4/17/20 4/19/20 4/21/20 4/23/20 4/25/20 4/27/20 4/29/20 5/1/20 5/3/20 5/5/20 5/7/20 5/9/20 5/11/20 5/13/20 5/15/20 5/17/20 5/19/20 5/21/20 5/23/20 5/25/20 5/27/20 5/29/20 5/31/20 6/2/20 6/4/20 6/6/20 6/8/20 6/10/20 6/12/20 6/14/20 6/16/20 6/18/20 6/20/20 6/22/20 6/24/20 6/26/20 6/28/20 6/30/20 7/2/20 7/4/20 7/6/20 7/8/20 7/10/20 7/12/20 7/14/20 7/16/20 7/18/20

Percent Change in Mobility

Retail & Recreation Grocery & Pharmacy Transit Stations (gas stations, rest areas, etc.) Workplaces Residential Average Non-Residential

Baseline: normal value for day of week (1/3-2/6/20) Residential shows a change in duration, other categories are change in total visitors. Parks not shown. Data from https://www.google.com/covid19/mobility/

slide-27
SLIDE 27

Brookings County Mobility Data via Google

  • 75
  • 25

25 75

2/15/20 2/17/20 2/19/20 2/21/20 2/23/20 2/25/20 2/27/20 2/29/20 3/2/20 3/4/20 3/6/20 3/8/20 3/10/20 3/12/20 3/14/20 3/16/20 3/18/20 3/20/20 3/22/20 3/24/20 3/26/20 3/28/20 3/30/20 4/1/20 4/3/20 4/5/20 4/7/20 4/9/20 4/11/20 4/13/20 4/15/20 4/17/20 4/19/20 4/21/20 4/23/20 4/25/20 4/27/20 4/29/20 5/1/20 5/3/20 5/5/20 5/7/20 5/9/20 5/11/20 5/13/20 5/15/20 5/17/20 5/19/20 5/21/20 5/23/20 5/25/20 5/27/20 5/29/20 5/31/20 6/2/20 6/4/20 6/6/20 6/8/20 6/10/20 6/12/20 6/14/20 6/16/20 6/18/20 6/20/20 6/22/20 6/24/20 6/26/20 6/28/20 6/30/20 7/2/20 7/4/20 7/6/20 7/8/20 7/10/20 7/12/20 7/14/20 7/16/20 7/18/20

Percent Change in Mobility

Retail & Recreation Grocery & Pharmacy Transit Stations (gas stations, rest areas, etc.) Workplaces Residential Average Non-Residential

Baseline: normal value for day of week (1/3-2/6/20) Residential shows a change in duration, other categories are change in total visitors. Parks not shown. Data from https://www.google.com/covid19/mobility/

slide-28
SLIDE 28

Speed of Spread Through Countries & States

(no longer updated)

slide-29
SLIDE 29

World Health Organization COVID-19 Situation Beginning 1/20/20

24 59 202 May 1st 212

50 100 150 200 250

1 2 3 4 5 6 7 8 9 1 0 1 1 1 2 1 3 1 4 1 5 1 6 1 7 1 8 1 9 2 0 2 1 2 2 2 3 2 4 2 5 2 6 2 7 2 8 2 9 3 0 3 1 3 2 3 3 3 4 3 5 3 6 3 7 3 8 3 9 4 0 4 1 4 2 4 3 4 4 4 5 4 6 4 7 4 8 4 9 5 0 5 1 5 2 5 3 5 4 5 5 5 6 5 7 5 8 5 9 6 0 6 1 6 2 6 3 6 4 6 5 6 6 6 7 6 8 6 9 7 0 7 1 7 2 7 3 7 4 7 5 7 6 7 7 7 8 7 9 8 0 8 1 8 2 8 3 8 4 8 5 8 6 8 7 8 8 8 9 9 0 9 1 9 2 9 3 9 4 9 5 9 6 9 7 9 8 9 9 1 0 1 0 1 1 0 2

Cumulative Number of Countries Reporting Active Cases

WHO WorldoMeter

Day

https://www.who.int/emergencies/diseases/novel-coronavirus-2019/situation-reports https://www.worldometers.info/coronavirus/

Numbers given for the first of February, March, April, and May.

slide-30
SLIDE 30

10 20 30 40 50

1 2 3 4 5 6 7 8 9 10 11 12 13 14 15 16 17 18 19 20 21 22 23 24 25 26 27 28 29 30 31

Number of States Reporting Active Cases of COVID-19

States - news sources States-CDC

March

U.S. COVID-19 Situation

https://www.cdc.gov/coronavirus/2019-ncov/cases-in-us.html

CDC reported all 50 states having COVID-19 on 3/18/20.