
SLIDE 1
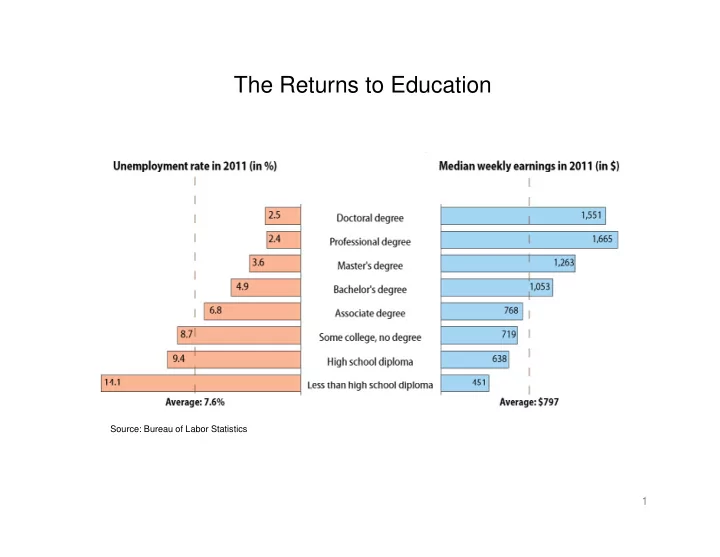
The Returns to Education
Source: Bureau of Labor Statistics
1
The Returns to Education Source: Bureau of Labor Statistics 1 - - PowerPoint PPT Presentation
The Returns to Education Source: Bureau of Labor Statistics 1 Total Enrollment Over Time 16,000,000 14,000,000 , , 12,000,000 10,000,000 8,000,000 6,000,000 4,000,000 4,000,000 2,000,000 0 1985 1985 1990 1990 1995 1995 2000
Source: Bureau of Labor Statistics
1
Source: Table 197 of the Digest of Education Statistics 2010 (Snyder & Dillow, 2011).
2
Source: Table 197 of the Digest of Education Statistics 2010 (Snyder & Dillow, 2011). Note: Figures include both undergraduate and graduate students, though graduate students constitute only 15 percent of total enrollment.
Source: Figure 5 of Trends in College Pricing 2010 (Baum & Ma, 2010).
3
Source: Figure 5 of Trends in College Pricing 2010 (Baum & Ma, 2010). Note: Tuition figures have been adjusted for inflation.
70% 40% 50% 60% 20% 30% % 0% 10% 1985 1990 1995 2000 2005 2010
Source: Data from Integrated Postsecondary Education Data System (IPEDS) and the Delta Cost Project.
Tuition and fees (including financial aid) State/local appropriations 4
0.5% 0.6% $ $50 $60 0.48% 0 2% 0.3% 0.4% $20 $30 $40 0.29% 0.0% 0.1% 0.2% $0 $10 $20 1957 1963 1969 1975 1981 1987 1993 1999 2005 2011
Real deposits $2005 B (LHS) GDP share (RHS)
Source: Department of Transportation, Federal Highway Administration
5
Source: Department of Transportation, Federal Highway Administration Note: Highway Trust Fund deposits converted to real terms using the GDP deflator. Fund deposits reflect both the Highway Account and, starting in 1983, the Mass Transit Account. The GDP share is the ratio of nominal Fund deposits over nominal GDP.
18% 20% 14% 16% 18% 8% 10% 12% 2% 4% 6%
0% 1957 1963 1969 1975 1981 1987 1993 1999 2005 2011
6
Source: Department of Transportation, Federal Highway Administration