
SLIDE 1
1
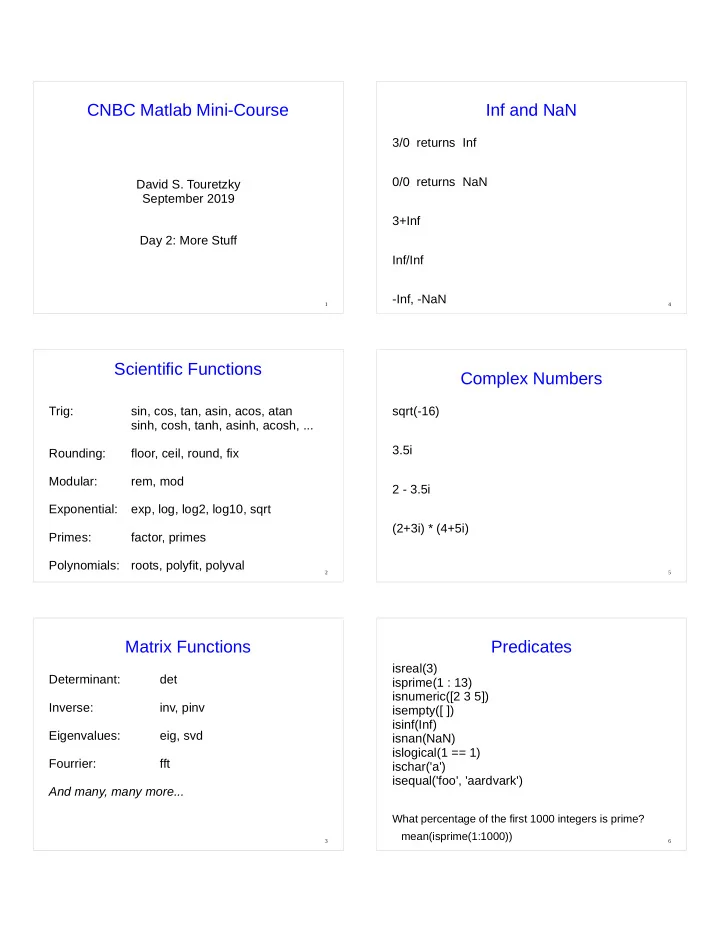
CNBC Matlab Mini-Course
David S. Touretzky September 2019 Day 2: More Stuff
2
Scientific Functions
Trig: sin, cos, tan, asin, acos, atan sinh, cosh, tanh, asinh, acosh, ... Rounding: floor, ceil, round, fix Modular: rem, mod Exponential: exp, log, log2, log10, sqrt Primes: factor, primes Polynomials: roots, polyfit, polyval
3
Matrix Functions
Determinant: det Inverse: inv, pinv Eigenvalues: eig, svd Fourrier: fft And many, many more...
4
Inf and NaN
3/0 returns Inf 0/0 returns NaN 3+Inf Inf/Inf
- Inf, -NaN
5
Complex Numbers
sqrt(-16) 3.5i 2 - 3.5i (2+3i) * (4+5i)
6