
SLIDE 1
1
CNBC Matlab Mini-Course
David S. Touretzky September 2019 Day 1: Essentials
2
What Is Matlab?
- Product of The Mathworks, Inc.
http://www.mathworks.com
- Runs on Linux, Windows, and Macs.
- Student version just $49 (plus toolboxes).
- Latest release is Matlab R2019b.
- “Interactive” interface like BASIC, Python, Lisp,
- etc. Type in expressions and see the result.
3
What Is Matlab? (cont.)
- Full programming language.
- Strong on matrix manipulation and graphics.
- Optional toolboxes for statistics, image
processing, signal processing, etc.
- Interfaces with C, Fortran, and Java.
- Can create stand-alone executable files.
– HHsim, a Hodgkin-Huxley simulator developed by Dave
Touretzky with help from Jon Johnson, is distributed as a stand-alone executable. (Source is also available.)
4
Why Should You Learn Matlab?
- Data analysis:
- Much more versatile than a spreadsheet.
- Extensive statistics toolbox.
- SPM uses Matlab.
- Graphics:
- Many ways to visualize your data – even animations!
- Produce great figures for your papers.
- Modeling and simulation:
- Best choice for neural net simulations.
5
Getting Started
- Log in to a workstation.
- Go to the menu bar at the top of your screen
and select: Applications > Education > MATLAB
6
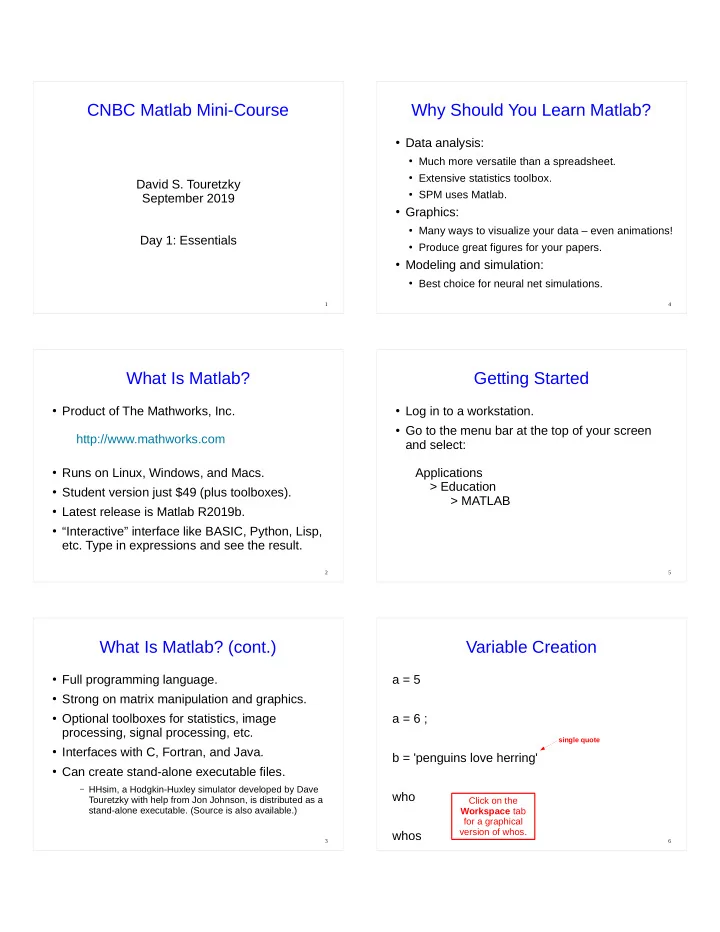
Variable Creation
a = 5 a = 6 ; b = 'penguins love herring' who whos
single quote