
Statistical Literacy: Scanlan’s Paradox V1C 2020-Schield-ASA-Slides.pdf 2020-Schield-ASA-Slides-Audio.mp4 1
Schield: 2020 ASA SlidesV1C 1
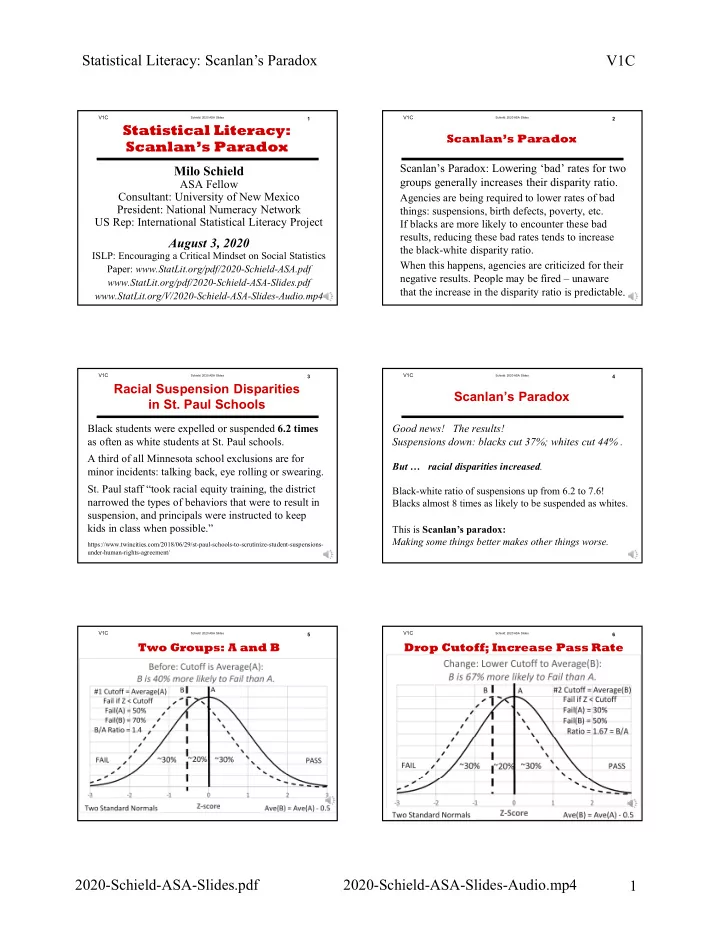
Milo Schield
ASA Fellow Consultant: University of New Mexico President: National Numeracy Network US Rep: International Statistical Literacy Project
August 3, 2020
ISLP: Encouraging a Critical Mindset on Social Statistics Paper: www.StatLit.org/pdf/2020-Schield-ASA.pdf www.StatLit.org/pdf/2020-Schield-ASA-Slides.pdf www.StatLit.org/V/2020-Schield-ASA-Slides-Audio.mp4
Statistical Literacy: Scanlan’s Paradox
Schield: 2020 ASA SlidesV1C
Scanlan’s Paradox: Lowering ‘bad’ rates for two groups generally increases their disparity ratio.
Agencies are being required to lower rates of bad things: suspensions, birth defects, poverty, etc. If blacks are more likely to encounter these bad results, reducing these bad rates tends to increase the black-white disparity ratio. When this happens, agencies are criticized for their negative results. People may be fired – unaware that the increase in the disparity ratio is predictable.
2
Scanlan’s Paradox
Schield: 2020 ASA SlidesV1C 3
Black students were expelled or suspended 6.2 times as often as white students at St. Paul schools. A third of all Minnesota school exclusions are for minor incidents: talking back, eye rolling or swearing.
- St. Paul staff “took racial equity training, the district
narrowed the types of behaviors that were to result in suspension, and principals were instructed to keep kids in class when possible.”
https://www.twincities.com/2018/06/29/st-paul-schools-to-scrutinize-student-suspensions- under-human-rights-agreement/
Racial Suspension Disparities in St. Paul Schools
Schield: 2020 ASA SlidesV1C 4
Good news! The results! Suspensions down: blacks cut 37%; whites cut 44% .
Scanlan’s Paradox
But … racial disparities increased. Black-white ratio of suspensions up from 6.2 to 7.6! Blacks almost 8 times as likely to be suspended as whites. This is Scanlan’s paradox: Making some things better makes other things worse.
Schield: 2020 ASA SlidesV1C
.
5
Two Groups: A and B
Schield: 2020 ASA SlidesV1C
.
6
Drop Cutoff; Increase Pass Rate B is 67% more likely to fail than A!