
Statistical Literacy: Confounding Dec 2010 2010-Schield-UST-Confounding-Slides.pdf 1
Fall 2010 1MILO SCHIELD,
Augsburg College
Director, W. M. Keck Statistical Literacy Project Vice President, National Numeracy Network
University of St. Thomas. December 2010 Slides at www.StatLit.org/pdf/ 2010-Schield-UST-Confounding-Slides.pdf
Statistical Literacy: Confounding
Fall 2010 2Statistical Literacy
Statistical literacy is the ability to read and interpret summary statistics in everyday life. Statistical Literacy studies (1) the relation between statistical associations and causation, and (2) the kinds of influence on a statistic or statistical association. [Take CARE]
Fall 2010 3Take CARE
C: Context The influence of factors taken into account
- by comparisons of counts, averages, ratios and
comparisons of averages and ratios;
- by epidemiological models (cf., deaths attributable to
- besity);
- by regression models; and
- by the study design (cf., controlled vs. uncontrolled;
longitudinal vs. cross-sectional; experiment vs.
- bservational study) or by selection in tables and graphs.
The influence of related factors (confounders) not taken into account in the study and not blocked by the study design.
Fall 2010 4Take CARE
C: Context
The influence of related factors (confounders) that were not taken into account in the study and that were not blocked by the study design. Two continuous measures
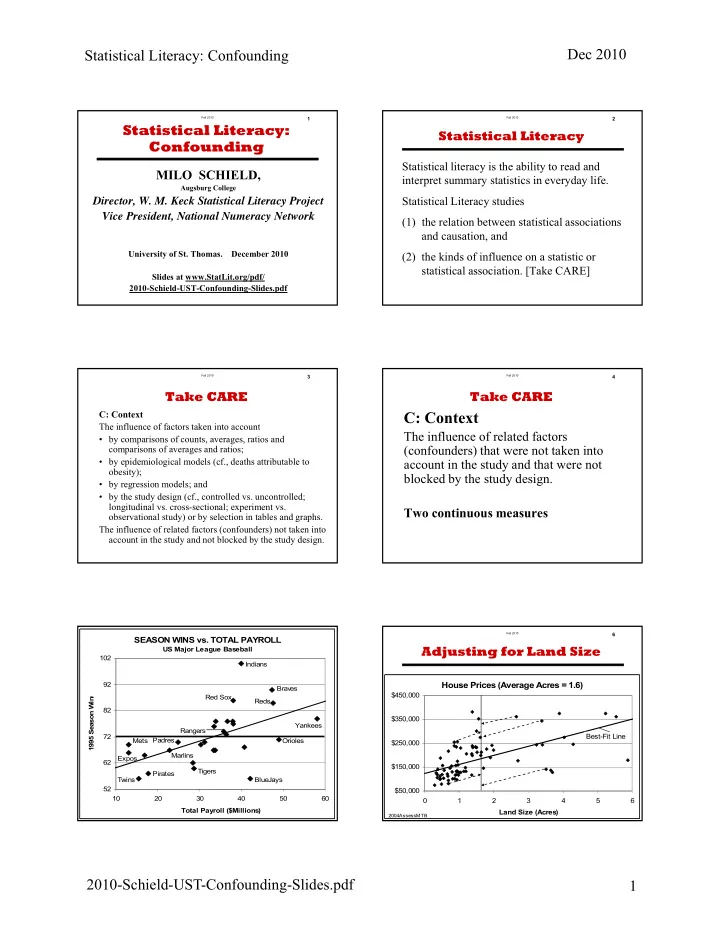
Fall 2010 5Association vs. Causation
.
SEASON WINS vs. TOTAL PAYROLL
US Major League Baseball 52 62 72 82 92 102 10 20 30 40 50 60 Total Payroll ($Millions) 1995 Season Wins Yankees BlueJays Indians Twins Marlins Rangers Mets Padres Braves Orioles Red Sox Reds Expos Pirates Tigers
Fall 2010 6Adjusting for Land Size
House Prices (Average Acres = 1.6)
$50,000 $150,000 $250,000 $350,000 $450,000 1 2 3 4 5 6 Land Size (Acres)
2004AssessMTBBest-Fit Line