
SLIDE 1
201
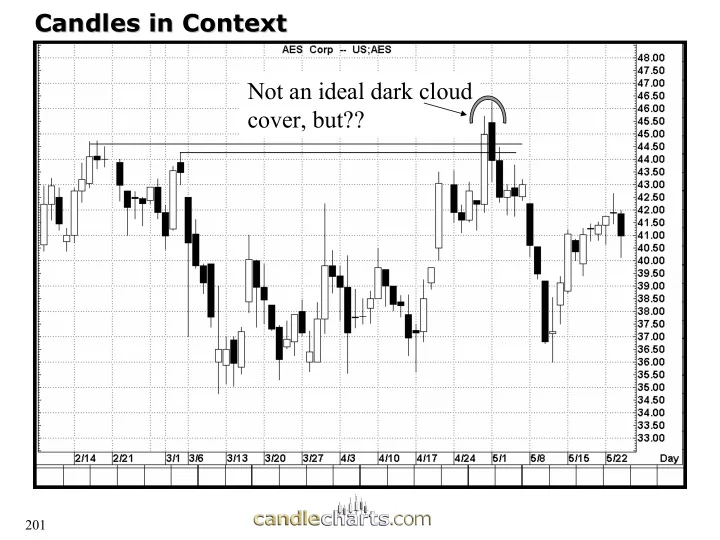
Candles in Context Candles in Context Not an ideal dark cloud cover, but??
Candles in Context Candles in Context Not an ideal dark cloud - - PowerPoint PPT Presentation
Candles in Context Candles in Context Not an ideal dark cloud cover, but?? 201 Trading Tactics - - Candles in Context Candles in Context Trading Tactics 1 a) What are the candle lines at the arrows at 1 and 2 ? b) Where would you be more
201
Candles in Context Candles in Context Not an ideal dark cloud cover, but??
202
Trading Tactics Trading Tactics -
Candles in Context
a) What are the candle lines at the arrows at 1 and 2 ? b) Where would you be more bullish, at 1 or 2, and why? c) On what candle line would you buy after the signals at 1 and 2? d) If you buy at 1 or 2 where is a potential protective sell stop? 1 2
203
204 204
How are new highs are made
205
How are new highs or lows made How are new highs or lows made
New High Close
Bulls’ can’t sustain rallies for more than
my the red arrow.
206
207
How are new highs/lows made? How are new highs/lows made?
208
The water looks fine! The water looks fine!
209
Candlecharts.com
210
211
Stops Stops
212
Stops Stops
Window as support shown by bullish shadows and hammers at the arrows. Once the support is broken we must readjust our bullish view. window
213
Obtaining targets Obtaining targets
Buy on the hammer during the week of April 8, an obvious resistance area would be towards 615.
hammer
214
Obtaining Price Targets Obtaining Price Targets
Shooting star confirms resistance at top end of box range. Sell on the shooting star with a potential target at bottom
Shooting Star
215
Using Western TA for target Using Western TA for target
19 25 4 March 11 18 25 1 April 8 15 22 29 May 6 970 975 980 985 990 995 1000 1005 1010 1015 1020 1025 1030 1035 1040 1045 1050 1055 1060 1065 1070 1075
x10
DJ INDU AVERAGE
Bullish engulfing pattern gives a turning signal with falling resistance line as a target
216
Trading Tactics Trading Tactics-
Case Study
15 22 29 May 6 13 20 28 10.9 11.0 11.1 11.2 11.3 11.4 11.5 11.6 11.7 11.8 11.9 12.0 12.1 12.2 12.3 12.4 12.5 12.6 12.7 12.8 12.9 13.0 13.1 13.2 13.3 13.4 13.5 COMVERSE TECH
Bullish shadows at arrows show demand. A hammer is a potential buy signal. If the trader feels that the market was to high to buy on the next session’s open, there is now a window as support. On a correction, we can buy within the window. A potential target is the April highs near 13.4. Once there a bearish engulfing pattern confirms this resistance.
Hammer
Rising window
Bearish engulfing pattern
217
Trading Tactics Trading Tactics-
Targets
3 20 28 3 June 10 17 24 1 July 8 15 300 400 500 600 700 800 900 1000
x1000
Volume 26.0 26.5 27.0 27.5 28.0 28.5 29.0 29.5 30.0 30.5 31.0 31.5 32.0 FIDELITY NATL
1) Buy on first hammer, exit at bearish engulfing pattern (circled). This bearish engulfing pattern took on extra significance since it also confirmed resistance. Or 2) Sell short at bearish engulfing pattern and exit at second hammer (which confirmed the first hammer’s support area).
hammers
218
Trading Tactics Trading Tactics-
Targets Use hammer to buy and window to exit hammer
Falling window
219
Hammer and Risk/Reward Hammer and Risk/Reward Risk reward
220
Risk/Reward Risk/Reward
14 22 28 4 February 11 19 25 Ma 60.0 60.5 61.0 61.5 62.0 62.5 63.0 63.5 64.0 64.5 65.0 65.5 66.0 66.5 67.0 67.5 68.0 68.5 69.0 69.5 INTL GAME TECH
Morning doji star as support. Buy on hammer, target is recent pivot high. This represents an attrive r/r. Pivot high