
Statistical Literacy: Harper's Magazine Nov 2010 2010-Schield-Harpers-Index-Slides.pdf 1
Fall 20101
MILO SCHIELD,
Augsburg College
Director, W. M. Keck Statistical Literacy Project Vice President, National Numeracy Network
November 2010 Slides at www.StatLit.org/pdf/ 2010-Schield-Harpers-Index-Slides.pdf
Statistical Literacy: Harper’s Index
Fall 20102
Statistical Literacy
Statistical literacy is the ability to read and interpret summary statistics in everyday life. Statistical Literacy studies (1) relation between association and causation, (2) kinds of influence on a statistic (3) devices used to describe counts or measures Harper’s index is a source of everyday statistics.
Fall 20103
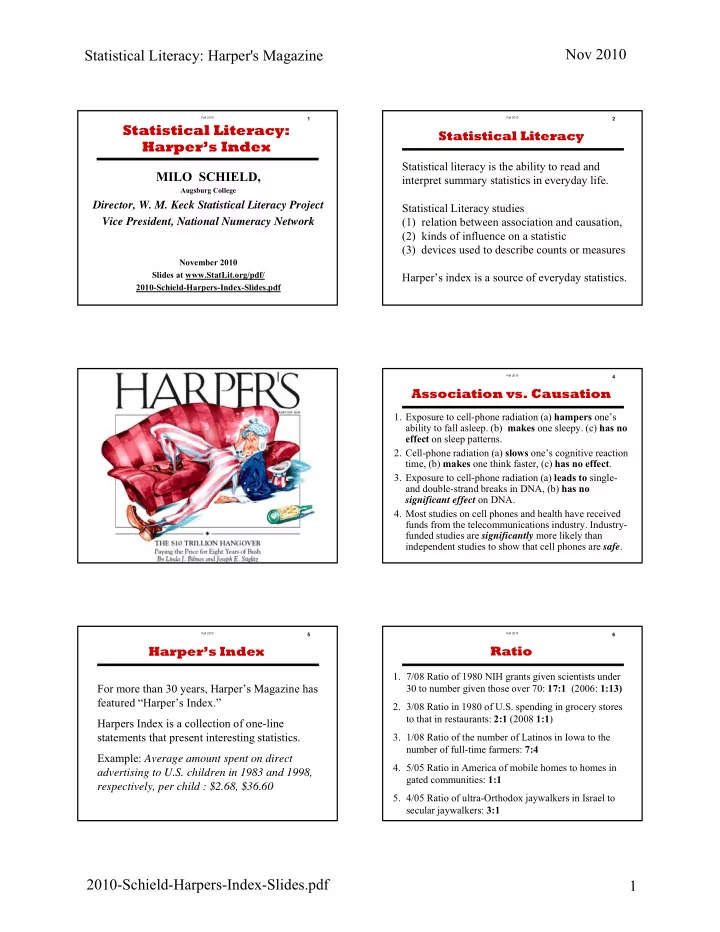
Harper’s Magazine
.
Fall 20104
Association vs. Causation
- 1. Exposure to cell-phone radiation (a) hampers one’s
ability to fall asleep. (b) makes one sleepy. (c) has no effect on sleep patterns.
- 2. Cell-phone radiation (a) slows one’s cognitive reaction
time, (b) makes one think faster, (c) has no effect.
- 3. Exposure to cell-phone radiation (a) leads to single-
and double-strand breaks in DNA, (b) has no significant effect on DNA.
- 4. Most studies on cell phones and health have received
funds from the telecommunications industry. Industry- funded studies are significantly more likely than independent studies to show that cell phones are safe.
Fall 20105
Harper’s Index
For more than 30 years, Harper’s Magazine has featured “Harper’s Index.” Harpers Index is a collection of one-line statements that present interesting statistics. Example: Average amount spent on direct advertising to U.S. children in 1983 and 1998, respectively, per child : $2.68, $36.60
Fall 20106
Ratio
- 1. 7/08 Ratio of 1980 NIH grants given scientists under
30 to number given those over 70: 17:1 (2006: 1:13)
- 2. 3/08 Ratio in 1980 of U.S. spending in grocery stores
to that in restaurants: 2:1 (2008 1:1)
- 3. 1/08 Ratio of the number of Latinos in Iowa to the
number of full-time farmers: 7:4
- 4. 5/05 Ratio in America of mobile homes to homes in
gated communities: 1:1
- 5. 4/05 Ratio of ultra-Orthodox jaywalkers in Israel to
secular jaywalkers: 3:1