
Odyssey: A Journey to Lifelong Statistical Literacy July 17, 2014 2014-Schield-ICOTS-Slides 1
2014 ICOTS1
Milo Schield
Editor: www.StatLit.org Elected member: International Statistical Institute US Chair: International Statistical Literacy Project
17 July 2014 ICOTS-9
www.StatLit.org/pdf/2014-Schield-ICOTS-Slides.pdf
ODYSSEY: A Journey to Lifelong Statistical Literacy
2014 ICOTS2
Statistical literacy (critical thinking with statistics) requires
- analytical skills: decoding statistical summaries,
grammar and arguments
- communication skills: how the presentation influences
the apparent strength of an argument
Statistical Literacy: Teaching vs. Practicing
Students need lots of practice to develop these skills. Students remember 90% of the subject matter if they do the task themselves even as a simulation, as opposed to 10%, 20% and 50% if they read, hear or watch someone else do the task respectively. Menn (1993)
2014 ICOTS3
Learning without retention is a tremendous waste. Students in a traditional [statistics] course lost 48%
- f their course gain within 4 months after the
- course. Title et al. (2012).
Forgetting; Group Learning
Group learning can be a powerful tool. Doing this
- nline is almost impossible without some kind of
forum.
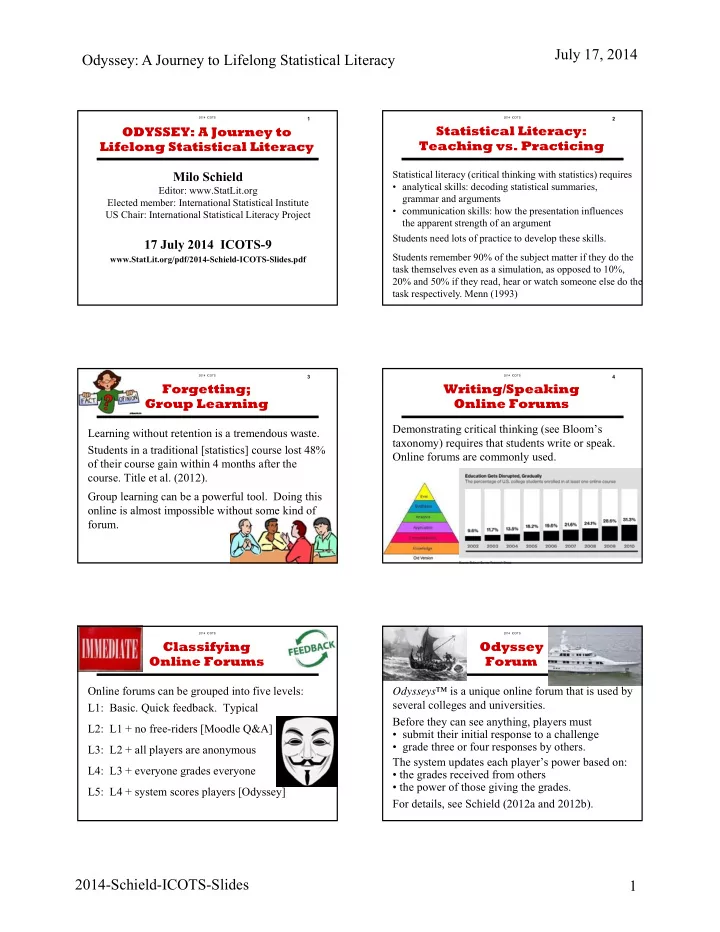
2014 ICOTSWriting/Speaking Online Forums
4
Demonstrating critical thinking (see Bloom’s taxonomy) requires that students write or speak. Online forums are commonly used.
2014 ICOTS5
Online forums can be grouped into five levels: L1: Basic. Quick feedback. Typical L2: L1 + no free-riders [Moodle Q&A] L3: L2 + all players are anonymous L4: L3 + everyone grades everyone L5: L4 + system scores players [Odyssey]
Classifying Online Forums
2014 ICOTS6
Odysseys™ is a unique online forum that is used by several colleges and universities. Before they can see anything, players must
- submit their initial response to a challenge
- grade three or four responses by others.
The system updates each player’s power based on:
- the grades received from others
- the power of those giving the grades.
For details, see Schield (2012a and 2012b).
Odyssey Forum