
Increasing Disparity: The Scanlan Effect 14 Oct 2018 V1A 2018-Schield-NNN-Slides.pdf 1
Increasing Disparity: The Scanlan EffectV1A
1
Milo Schield Augsburg University
Editor of www.StatLit.org Fellow, American Statistical Association US Rep: International Statistical Literacy Project
2018 National Numeracy Network Conference
www.StatLit.org/pdf/2018-Schield-NNN-Slides.pdf
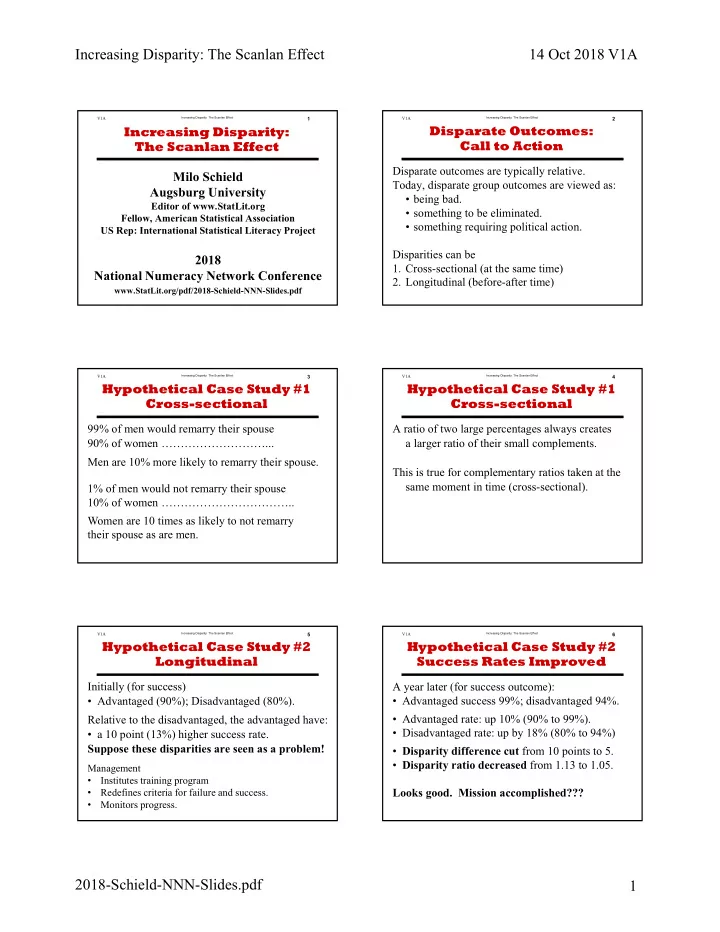
Increasing Disparity: The Scanlan Effect
Increasing Disparity: The Scanlan EffectV1A
2
Disparate outcomes are typically relative. Today, disparate group outcomes are viewed as:
- being bad.
- something to be eliminated.
- something requiring political action.
Disparities can be
- 1. Cross-sectional (at the same time)
- 2. Longitudinal (before-after time)
Disparate Outcomes: Call to Action
Increasing Disparity: The Scanlan EffectV1A
3
99% of men would remarry their spouse 90% of women ………………………... Men are 10% more likely to remarry their spouse.
Hypothetical Case Study #1 Cross-sectional
1% of men would not remarry their spouse 10% of women …………………………….. Women are 10 times as likely to not remarry their spouse as are men.
Increasing Disparity: The Scanlan EffectV1A
4
A ratio of two large percentages always creates a larger ratio of their small complements. This is true for complementary ratios taken at the same moment in time (cross-sectional).
Hypothetical Case Study #1 Cross-sectional
Increasing Disparity: The Scanlan EffectV1A
5
Initially (for success)
- Advantaged (90%); Disadvantaged (80%).
Relative to the disadvantaged, the advantaged have:
- a 10 point (13%) higher success rate.
Suppose these disparities are seen as a problem!
Hypothetical Case Study #2 Longitudinal
Management
- Institutes training program
- Redefines criteria for failure and success.
- Monitors progress.
V1A
6
A year later (for success outcome):
- Advantaged success 99%; disadvantaged 94%.
- Advantaged rate: up 10% (90% to 99%).
- Disadvantaged rate: up by 18% (80% to 94%)
- Disparity difference cut from 10 points to 5.
- Disparity ratio decreased from 1.13 to 1.05.
Looks good. Mission accomplished???
Hypothetical Case Study #2 Success Rates Improved