1 understanding social statistics v0g 7 21 2016
play

1. Understanding Social Statistics V0G 7/21/2016 V0G 2016 IASE-1 - PDF document

1. Understanding Social Statistics V0G 7/21/2016 V0G 2016 IASE-1 1 V0F 2016 IASE 1 2 Teaching Social Statistics Overview Association & Assembly Teaching Social Statistics Part 1: Stat Ed should offer 3 intro stat courses. Milo


  1. 1. Understanding Social Statistics V0G 7/21/2016 V0G 2016 IASE-1 1 V0F 2016 IASE 1 2 Teaching Social Statistics Overview Association & Assembly Teaching Social Statistics Part 1: Stat Ed should offer 3 intro stat courses. Milo Schield, Augsburg College • Stat 100: Statistical Literacy in the Media Member: International Statistical Institute • Stat 101: Traditional Research Statistics US Rep: International Statistical Literacy Project • Stat 102: Statistics for Decision Makers VP. National Numeracy Network Augsburg offers all three: 100@20 yr, 102@4 yr IASE Roundtable in Berlin Part 2: Teach multivariate thinking & confounding July 20, 2016 www.StatLit.org/pdf/2016-Schield-IASE-1Slides.pdf Part 3: Teach Inference and confounder influence. V0F V0F 2016 IASE 1 3 2016 IASE 1 4 What are Statistics? What are Social Statistics? Two Definitions This is [absolutely] the wrong place to start. 1. Quantitative data from random samples – samples created by random selection (surveys) One must be very careful in making the first few or by random assignment (clinical trials). steps in any journey. 2. Numbers in context where the context matters. Counts and measures of real things. The proper first question is “What are statistics?” This choice determines the nature of the course. Different answers lead to different courses! “Different answers” is the biggest – the most The first leads to a “Math-Stats” course; fundamental – problem in statistical education. the second leads to an “Applied” course. 6 V0F 2016 IASE 1 5 V0F 2016 IASE 1 Statistics (#2) is Different 
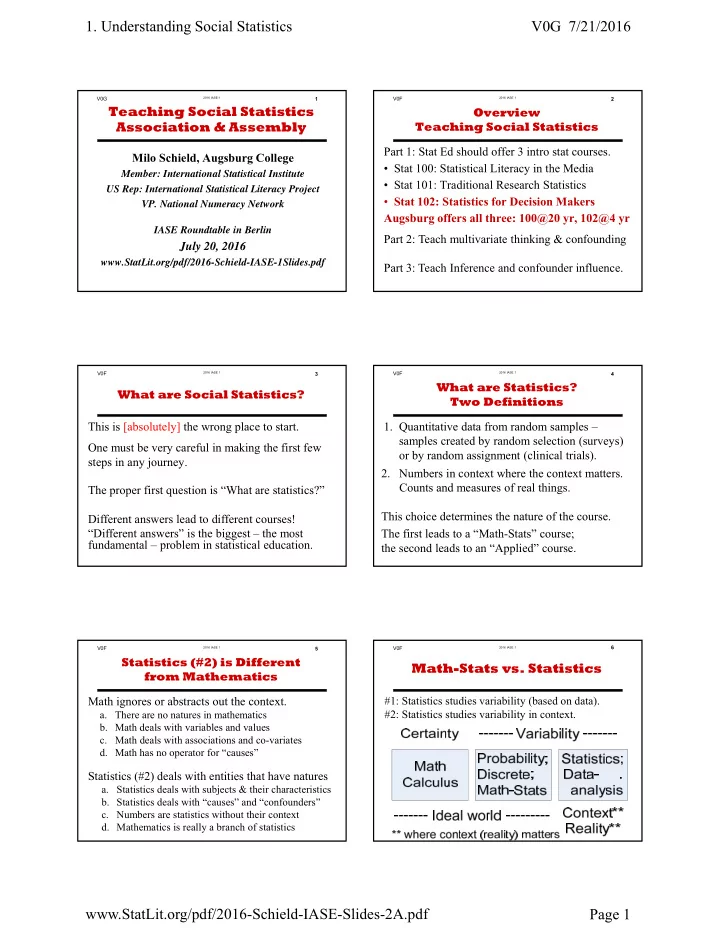
Math-Stats vs. Statistics from Mathematics Math ignores or abstracts out the context. #1: Statistics studies variability (based on data). #2: Statistics studies variability in context. a. There are no natures in mathematics b. Math deals with variables and values c. Math deals with associations and co-variates d. Math has no operator for “causes” Statistics (#2) deals with entities that have natures a. Statistics deals with subjects & their characteristics b. Statistics deals with “causes” and “confounders” c. Numbers are statistics without their context d. Mathematics is really a branch of statistics www.StatLit.org/pdf/2016-Schield-IASE-Slides-2A.pdf Page 1

  2. 1. Understanding Social Statistics V0G 7/21/2016 V0F 2016 IASE 1 7 V0G 2016 IASE-1 8 What are Social Statistics? Teaching Statistics Two definitions 1. Random-sample data involving social “We teach the wrong stuff ; We teach it the wrong conditions or activities. Typically surveys by way ; We teach it in the wrong order .” de Veaux government agencies. Focus on sampling, Consider teaching “Association is not causation” margin of error and bias. • 1973 Berkeley sex discrimination case • Ice cream sales and burglaries 2. All data involving social conditions or activities. Much – if not most -- of this data is: Problem: These involve confounding – not chance. • population data (administrative systems) Solution: Chance-based associations. • longitudinal (time-series) • Who gets longest run in 10 flips of a coin? • observational (susceptible to confounding) • How can we distinguish luck from skill? V0G V0F 2016 IASE-1 9 2016 IASE 1 10 How Should We Teach a What are Social Statistics? Social Statistics Course? Wrong question! . a. Statistics involving people First answer these questions: b. Statistics obtained from • Who are the students in Introductory Statistics? observational studies. • What are their goals and attitudes? • What aspects of statistics will help them in their major? Then answer this: • What are the primary contributions of statistics to human knowledge? V0F 2016 IASE 1 11 V0F 2016 IASE 1 12 Goals of the Students; Stat 101 students: Perspectives of the Teachers What are their Attitudes? • Many (most?) see less value in statistics after the course Students’ majors. Teachers’ disciplinary home than before. • “Least valuable course in the Business-Econ core.” Augsburg Business-Economics majors. • Lost almost half of the course gain within 4 months Tintle et al, (2012) SERJ. • Lost 33% of what they knew on their final within 12 month in an online course. Nadir (2004) • Less than 0.2% will major in statistics (US nationwide). www.amstat.org/misc/StatsBachelors2003-2013.pdf 1,135 stat majors in 2013 at 32 colleges www.StatLit.org/pdf/2016-Schield-IASE-Slides-2A.pdf Page 2

  3. 1. Understanding Social Statistics V0G 7/21/2016 V0F 2016 IASE 1 13 V0G 2016 IASE-1 14 Three Audiences: We need to teach Three Courses Statistics for Decision Makers . “One size fits all” doesn’t work any more. Derivation CLT, We should drop the idea of “ the course ” in intro stats. CL, ME, Surveys, Hyp tests, Clinical Trials We should support three algebra-intro statistics courses: Quasi- Experiments, Stat 102 : Statistics for Decision Makers. Some Algebra Observational Studies Stat 101 : Traditional Research-Inference. Most Algebra Stat 100 : Statistical Literacy. Media-base, little Algebra At least half of all intro sections should be Stat 102. V0F V0F 2016 IASE 1 15 2016 IASE 1 16 Social Statistics: Association vs. Causation Associations Many (most?) students think that “association” is Baseball players whose names begin with the letter a collection of people with similar interests/goals, “D” are more likely to die young or a group of teams in a given sport or league. Asian-Americans are most susceptible to heart 1) Compare values of variables: As X  , Y  . attacks on the fourth day of the month 2) Compare averages of groups: Drinking a full pot of coffee every morning will Young adults with a bachelor's degree earned add years to your life, but one cup a day increases 62% more than high school completers. the risk of pancreatic cancer. If you get a B.A., you can expect to earn 62% Source: Standard Deviations: Flawed Assumptions, Tortured Data, more than if you just complete high school. and Other Ways to Lie with Statistics by Gary Smith (2015). V0F 2016 IASE 1 17 V0F 2016 IASE 1 18 Association vs. Causation Association vs. Causation: Using Ordinary English Can be Tricky How Climate Change is Fueling Rise in Shark Attacks . www.yahoo.com/news/climate-change-fueling-rise-shark-145333862.html www.StatLit.org/pdf/2016-Schield-IASE-Slides-2A.pdf Page 3

  4. 1. Understanding Social Statistics V0G 7/21/2016 V0F 2016 IASE 1 19 V0F 2016 IASE 1 20 Speculative [Spotty] Statistics Association vs. Causation Using Ordinary English Using Ordinary English Does a death certificate ever list air pollution as a cause of death? Does a coroner certify this? These are association-based statistics. These are speculative (spotty) statistics. V0F V0F 2016 IASE 1 21 2016 IASE 1 22 Observational Statistics Observational Statistics More Influences are Influenced By: Randomization eliminates many types of influence. C onfounding: [See Part 2] • what was – and was not – controlled for Inference models eliminate many others. • what kind of study was involved. Teaching random-sample statistics is simpler. A ssembly: [See Part 1] • how the statistics were selected, collected, defined, Observational statistics have a host of influences. grouped, summarized, compared and presented. Teaching observational statistics is harder. R andomness [See Part 3] E rror/bias Students need a structure that groups these Statistical admonition: “Take CARE ” influences into three or four categories. 24 V0F 2016 IASE 1 23 V0F 2016 IASE 1 Assembly: Stats as Premise(Crit. Thinking) Defining Groups Stats as Conclusion (Stat Literacy) . # US children: Elevated levels of lead: • 27,000 in 2009 • 259,000 in 2010 [Almost a factor of 10] In 2010, the CDC reduced the minimum for elevated levels of lead from 10 to five*. * micrograms per dl of blood www.cdc.gov/nceh/lead/data/StateConfirmedByYear1997-2011.htm www.StatLit.org/pdf/2016-Schield-IASE-Slides-2A.pdf Page 4

  5. 1. Understanding Social Statistics V0G 7/21/2016 V0F 2016 IASE 1 25 V0F 2016 IASE 1 26 Small Changes in Syntax; Assembly in Moore’s Big Changes in Semantics Concepts & Controversies . . V0F V0F 2016 IASE 1 27 2016 IASE 1 28 Assembly in Presentation Why Teachers Don’t Want 7 nano grams/gram (7/Million) to Teach Assembly . 1. Ordinary English is too ambiguous. 2. Leave this up to subject-matter experts. 3. This is not really “statistics” 4. Teaching it requires subject-matter expertise. 1. Ordinary English is how statistics are communicated 2. If we don’t teach it, students will never see it. 3. We define what is really “statistics”. 4. We can teach it without subject-matter expertise: Which is bigger in a class: (1) # of students, (2) # of male students, or (3) # of students in or waiting? V0F 2016 IASE 1 29 29 V0F 2016 IASE 1 30 30 Contributions of Statistics Most Important Topics/Ideas to Human Knowledge Augsburg StatLit Students . 1 Classify different kinds of influence (Take CARE) 2 Confounding 2 Hypothetical thinking: Plausible confounders, plausible definitions [Assembly]. 4 Statistics are more than numbers [Assembly] 5 Association-causation & Randomness (Luck vs. skill) 5 Bias: Placebo, single blind; double blind 5 Named Ratio grammar; Percent, Percentages, Rates www.StatLit.org/pdf/2016-Schield-IASE-Slides-2A.pdf Page 5

Download Presentation
Download Policy: The content available on the website is offered to you 'AS IS' for your personal information and use only. It cannot be commercialized, licensed, or distributed on other websites without prior consent from the author. To download a presentation, simply click this link. If you encounter any difficulties during the download process, it's possible that the publisher has removed the file from their server.

Recommend


More recommend