create sampling distributions from single die v0g 11 16
play

Create Sampling Distributions from Single Die V0G 11/16/2016 V0G - PDF document

Create Sampling Distributions from Single Die V0G 11/16/2016 V0G Create Sampling Distribution of a Single Die using COUNTIF in Excel 2013 1 V0G Create Sampling Distribution of a Single Die using COUNTIF in Excel 2013 2 Create Sampling


  1. Create Sampling Distributions from Single Die V0G 11/16/2016 V0G Create Sampling Distribution of a Single Die using COUNTIF in Excel 2013 1 V0G Create Sampling Distribution of a Single Die using COUNTIF in Excel 2013 2 Create Sampling Distributions The Goal and Approach from a Single Die in Excel 2013 Goal: to create the sampling distribution from a single die with various sample sizes using Excel 2013. Milo Schield A preformatted data spreadsheet is at www.StatLit.org/ Member: International Statistical Institute xls/Excel2013-Sampling-1Die-Data.xlsx US Rep: International Statistical Literacy Project This step-by-step demo is at www.StatLit.org/pdf/ Director, W. M. Keck Statistical Literacy Project • Excel2013-Sampling-1Die-Demo-Slides.pdf A picture of the output is at www.StatLit.org/pdf/ Slides at: www.StatLit.org/pdf/ Excel2013-Sampling-1Die-Demo-Output.pdf Excel2013-Sampling-1Die-Demo-Slides.pdf V0G Create Sampling Distribution of a Single Die using COUNTIF in Excel 2013 3 V0G Create Sampling Distribution of a Single Die using COUNTIF in Excel 2013 4 Steps in Creating Sampling 1a: Insert RandBetween(1,6) Distributions for a single die Function in AA5 Access Pre-formatted Data Worksheet: . 1. Insert RandBetween(1, 6) to simulate throw of die. 2. Create row averages: samples of 4, 16, 25, 50, 200. 3. Calculate population statistics for a single die. 4. Calculate summary sample statistics by sample size. 5. Group row averages into frequency bins. 6. Create line-graph histograms by sample size. Upload completed worksheet. Randomly generated numbers will be random! V0G Create Sampling Distribution of a Single Die using COUNTIF in Excel 2013 5 V0G Create Sampling Distribution of a Single Die using COUNTIF in Excel 2013 6 1b: Drag over 200 columns 2a: In S5, create row average to the right to HR5 with sample size four . Notice that the range is only four columns wide: AA5:AD5 Drag this first row of random numbers down 200 rows to Row 204 Averages of random numbers will be random! www.StatLit.org/pdf/Excel2013-Sampling-1Die-Demo-Slides.pdf 1

  2. Create Sampling Distributions from Single Die V0G 11/16/2016 V0G Create Sampling Distribution of a Single Die using COUNTIF in Excel 2013 7 V0G Create Sampling Distribution of a Single Die using COUNTIF in Excel 2013 8 2b: In T5, create row average 2d: Drag First Row Averages, with sample size of 16 S5:W5, down to Row 204. . In U5:W5, create row averages for sample sizes 25, 50 and 200 Right-end of ranges are shown in S2:W2 V0G Create Sampling Distribution of a Single Die using COUNTIF in Excel 2013 9 V0G Create Sampling Distribution of a Single Die using COUNTIF in Excel 2013 10 3a: Generate mean (average) 3b: Generate population [and median] for a six-sided die std. deviation for a fair die . In cell F4, insert =Median(B3:G3) In cell F5, insert =B5/((G3 – B3)/2) V0G Create Sampling Distribution of a Single Die using COUNTIF in Excel 2013 11 V0G Create Sampling Distribution of a Single Die using COUNTIF in Excel 2013 12 4a: Generate Mean [& Median] of 4b: Generate Sample Std.Dev Row Means for Sample Size 200 of Row Means for Size 200 . In cell H9, insert =Median(W5:W204) www.StatLit.org/pdf/Excel2013-Sampling-1Die-Demo-Slides.pdf 2

  3. Create Sampling Distributions from Single Die V0G 11/16/2016 V0G Create Sampling Distribution of a Single Die using COUNTIF in Excel 2013 13 V0G Create Sampling Distribution of a Single Die using COUNTIF in Excel 2013 14 4c: H11 Ratio of Std. Error 4d: Drag H8:H12 column to Population Std. Deviation left-ward to fill out the table . . Insert =1/SQRT(H7) into cell H12 V0G Create Sampling Distribution of a Single Die using COUNTIF in Excel 2013 15 V0G Create Sampling Distribution of a Single Die using COUNTIF in Excel 2013 16 5a: Insert COUNTIF function 5b: Insert “=CountIF() –Sum()” function in 2 nd row: H18 in H17 . . H18: Equivalent to =COUNTIF(W$5:W$204, "<="&$C18) - COUNTIF(W$5:W$204, "<="&$C17) Insert single $ sign in Sum function before first row. Insert $ sign in before Column in range; before Row in single cell! V0G Create Sampling Distribution of a Single Die using COUNTIF in Excel 2013 17 V0G Create Sampling Distribution of a Single Die using COUNTIF in Excel 2013 18 5c: Drag H18, =CountIF() –Sum(), 6a: Select Data (B17:H32) formula down to bottom row to use in Histogram . . Drag entire right column (H17:H32) left-ward to fill out frequency table. Insert SUM at bottom of each column. May be different from 200. Do not include H17 when dragging H18 downward!!! www.StatLit.org/pdf/Excel2013-Sampling-1Die-Demo-Slides.pdf 3

  4. Create Sampling Distributions from Single Die V0G 11/16/2016 V0G Create Sampling Distribution of a Single Die using COUNTIF in Excel 2013 19 V0G Create Sampling Distribution of a Single Die using COUNTIF in Excel 2013 20 6c: Format Horizontal Axis: 6b: Insert X-Y Scatter Plot Change Min and Max . . Delete legend. V0G Create Sampling Distribution of a Single Die using COUNTIF in Excel 2013 21 V0G Create Sampling Distribution of a Single Die using COUNTIF in Excel 2013 22 6d: Select/delete Series 5 6e: Insert Title and (size 50), 3 (size 16) and 1 (Max). Horizontal Axis Text . . V0G Create Sampling Distribution of a Single Die using COUNTIF in Excel 2013 23 V0G Create Sampling Distribution of a Single Die using COUNTIF in Excel 2013 24 6f: Insert legends in text boxes. Summary Final Result When sampling from a process, the population “size” is . Sampling Distribution of Sample Means: 6‐side Die “infinite”. That doesn’t influence the standard deviation. Sample sizes of 4, 25 and 200 120 Notice as sample size increases, the standard error (the 100 Size 200 std. deviation of the sample means) quickly decreases – 80 as a percentage of the population standard deviation. Count 60 40 Size 25 A sample of size 4 is expected to have a standard error 20 that is only a half of the population standard deviation: 0 a sample of 25 has a fifth, a sample of 100 has a tenth 2.00 2.50 3.00 3.50 4.00 4.50 5.00 ‐20 and a sample of 10,000 has a hundredth. Sample Means www.StatLit.org/pdf/Excel2013-Sampling-1Die-Demo-Slides.pdf 4

  5. V0G Create Sampling Distribution of a Single Die using COUNTIF in Excel 2013 1 Create Sampling Distributions from a Single Die in Excel 2013 
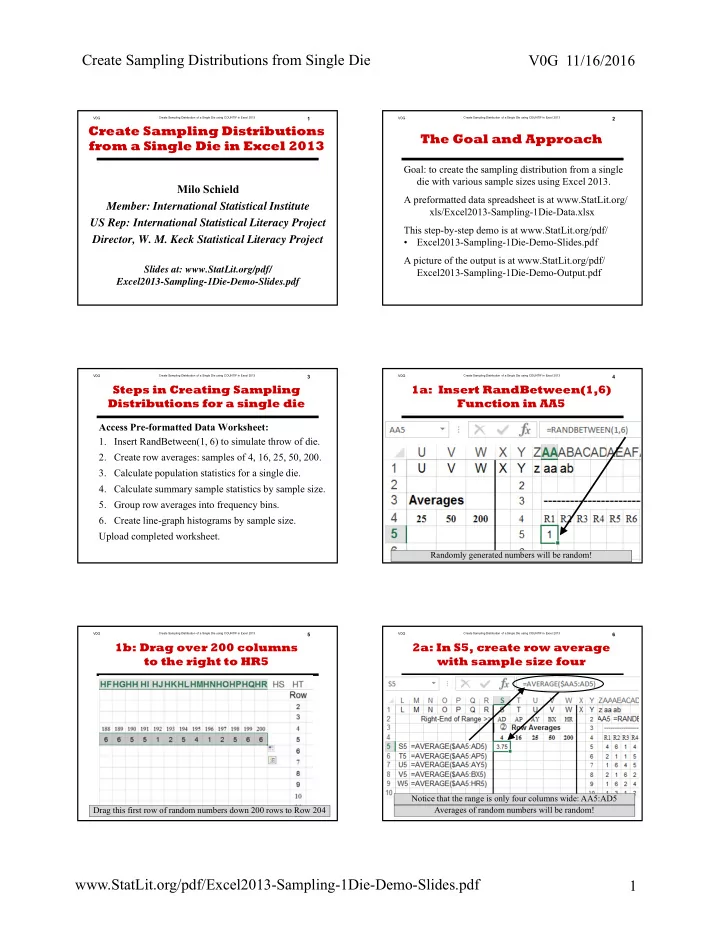
Milo Schield Member: International Statistical Institute US Rep: International Statistical Literacy Project Director, W. M. Keck Statistical Literacy Project Slides at: www.StatLit.org/pdf/ Excel2013-Sampling-1Die-Demo-Slides.pdf

  6. V0G Create Sampling Distribution of a Single Die using COUNTIF in Excel 2013 2 The Goal and Approach Goal: to create the sampling distribution from a single die with various sample sizes using Excel 2013. A preformatted data spreadsheet is at www.StatLit.org/ xls/Excel2013-Sampling-1Die-Data.xlsx This step-by-step demo is at www.StatLit.org/pdf/ • Excel2013-Sampling-1Die-Demo-Slides.pdf A picture of the output is at www.StatLit.org/pdf/ Excel2013-Sampling-1Die-Demo-Output.pdf

  7. V0G Create Sampling Distribution of a Single Die using COUNTIF in Excel 2013 3 Steps in Creating Sampling Distributions for a single die Access Pre-formatted Data Worksheet: 1. Insert RandBetween(1, 6) to simulate throw of die. 2. Create row averages: samples of 4, 16, 25, 50, 200. 3. Calculate population statistics for a single die. 4. Calculate summary sample statistics by sample size. 5. Group row averages into frequency bins. 6. Create line-graph histograms by sample size. Upload completed worksheet.

  8. V0G Create Sampling Distribution of a Single Die using COUNTIF in Excel 2013 4 1a: Insert RandBetween(1,6) Function in AA5 . Randomly generated numbers will be random!

  9. V0G Create Sampling Distribution of a Single Die using COUNTIF in Excel 2013 5 1b: Drag over 200 columns to the right to HR5 . Drag this first row of random numbers down 200 rows to Row 204

  10. V0G Create Sampling Distribution of a Single Die using COUNTIF in Excel 2013 6 2a: In S5, create row average with sample size four Notice that the range is only four columns wide: AA5:AD5 Averages of random numbers will be random!

  11. V0G Create Sampling Distribution of a Single Die using COUNTIF in Excel 2013 7 2b: In T5, create row average with sample size of 16 In U5:W5, create row averages for sample sizes 25, 50 and 200 Right-end of ranges are shown in S2:W2

  12. V0G Create Sampling Distribution of a Single Die using COUNTIF in Excel 2013 8 2d: Drag First Row Averages, S5:W5, down to Row 204. .

  13. V0G Create Sampling Distribution of a Single Die using COUNTIF in Excel 2013 9 3a: Generate mean (average) [and median] for a six-sided die . In cell F4, insert =Median(B3:G3)

  14. V0G Create Sampling Distribution of a Single Die using COUNTIF in Excel 2013 10 3b: Generate population std. deviation for a fair die In cell F5, insert =B5/((G3 – B3)/2)

  15. V0G Create Sampling Distribution of a Single Die using COUNTIF in Excel 2013 11 4a: Generate Mean [& Median] of Row Means for Sample Size 200 In cell H9, insert =Median(W5:W204)

  16. V0G Create Sampling Distribution of a Single Die using COUNTIF in Excel 2013 12 4b: Generate Sample Std.Dev of Row Means for Size 200 .

  17. V0G Create Sampling Distribution of a Single Die using COUNTIF in Excel 2013 13 4c: H11 Ratio of Std. Error to Population Std. Deviation . Insert =1/SQRT(H7) into cell H12

Download Presentation
Download Policy: The content available on the website is offered to you 'AS IS' for your personal information and use only. It cannot be commercialized, licensed, or distributed on other websites without prior consent from the author. To download a presentation, simply click this link. If you encounter any difficulties during the download process, it's possible that the publisher has removed the file from their server.

Recommend


More recommend