
Create Distributions Empirically using Excel V0E 10/11/2014 2014-Schield-Create-Distributions-Empirically-Excel-6up.pdf 1
2014 Schield Creating Distributions Empirically0E
1
Milo Schield
Augsburg College Editor of www.StatLit.org US Rep: International Statistical Literacy Project
Fall 2014 NNN Conference
www.StatLit.org/pdf/
2014-Schield-Create-Distributions-Empirically-Excel-6up.pdf
Creating Distributions Empirically
2014 Schield Creating Distributions Empirically0E
2
Generating Distributions
In introductory statistics, students are shown how the means of random samples form a sampling distribution that -- in the limit -- forms a Normal distribution. This is extremely useful in sampling. But the Normal distribution applies in situations that do not involve sampling – as do the Log-Normal and Exponential. Certain kinds of random activity can be shown to generate these well-known analytic distributions. Understanding how this happens can be very useful to managers making data-based decisions.
2014 Schield Creating Distributions Empirically0E
3
Generating Distributions:
Normal, Log-Normal & Exponential Mathematicians have proven:
- 1. The sum of an infinite number of independent random
variables generates a Normal distribution
- 2. The product of an infinite # of random, independent,
positive variables generates a Log-Normal distribution
- 3. A random process of assigning counts to cells in a
table can generate a chi-square distribution.
- 4. A process having a constant chance of ‘death’
generates an exponential distribution. Amazing! At the micro level, pure randomness. At the macro level, an analytic distribution emerges without any agency or intent. Micro randomness generates macro-
- rder: spontaneous and unplanned.
0E
4
Generating Distributions Empirically
Excel is used to generate these distributions empirically. The Normal and Log-Normal are the empirical results of 10,000 independent lines of activity. Each line receives:
- An add by a random amount (discrete or continuous)
generates a Normal distribution.
- a multiply by a positive random change (discrete or
continuous) generates a Log-Normal distribution. The Chi-square is the empirical result of randomly assign values to cells in a table (keeping the expected values equal) and then compute chi-square for each series. The Exponential is the empirical result of 2,000 lines of activity; each line has a fixed chance of death per period.
2014 Schield Creating Distributions Empirically0E
5
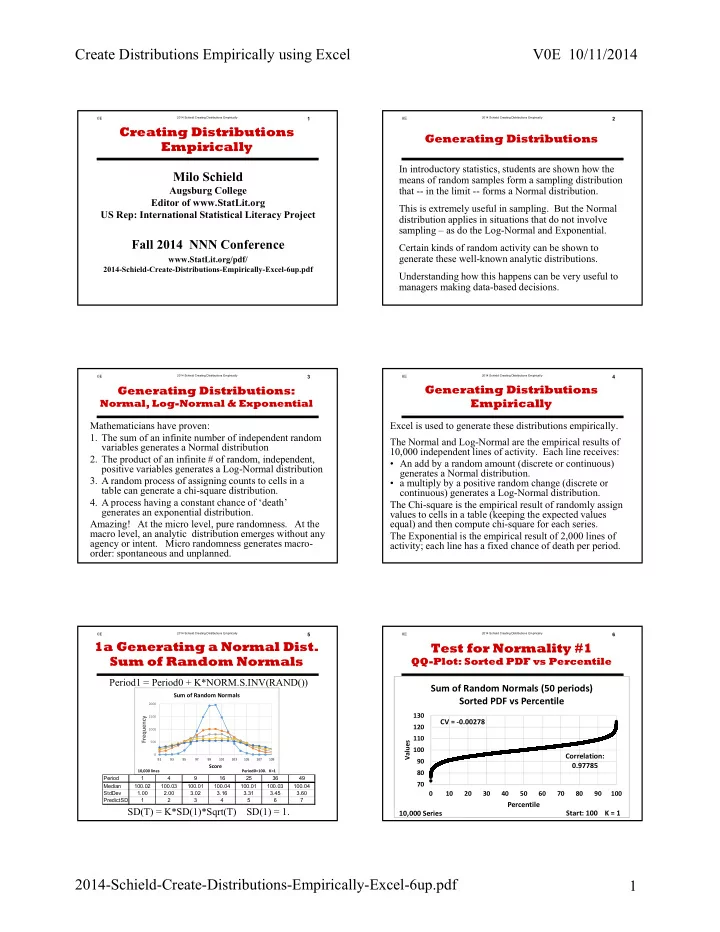
Period1 = Period0 + K*NORM.S.INV(RAND()) SD(T) = K*SD(1)*Sqrt(T) SD(1) = 1.
1a Generating a Normal Dist. Sum of Random Normals
500 1000 1500 2000 91 93 95 97 99 101 103 105 107 109Frequency
Score
Sum of Random Normals
10,000 lines Period0=100. K=1
Period 1 4 9 16 25 36 49 Median 100.02 100.03 100.01 100.04 100.01 100.03 100.04 StdDev 1.00 2.00 3.02 3.16 3.31 3.45 3.60 PredictSD 1 2 3 4 5 6 7
2014 Schield Creating Distributions Empirically0E
6
.
Test for Normality #1
QQ-Plot: Sorted PDF vs Percentile
70 80 90 100 110 120 130 10 20 30 40 50 60 70 80 90 100 Values
Percentile
Sum of Random Normals (50 periods) Sorted PDF vs Percentile
Start: 100 K = 1 Correlation: 0.97785 10,000 Series CV = ‐0.00278