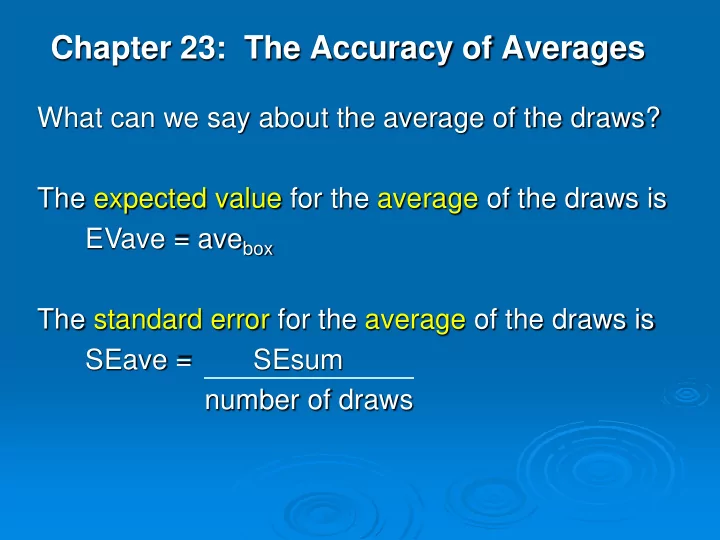

Chapter 23: The Accuracy of Averages What can we say about the average of the draws? The expected value for the average of the draws is EVave = ave box The standard error for the average of the draws is SEave = SEsum number of draws
For a large number of draws, the average of the draws will follow the normal curve with average EV ave and standard deviation SE ave . In particular, 68% of the time the average of the draws will be between EV ave – SE ave and EV ave + SE ave . 95% of the time the average of the draws will be between EV ave – 2 (SE ave ) and EV ave + 2(SE ave ). We can use the normal curve to find the chance that the average of the draws is in a region of interest. We use EV ave and SE ave to get standard units.
Note: • It does not matter what is in the box. • The histogram for the tickets in the box does not have to follow the normal curve. • The average of the draws will follow the normal curve, even if the tickets in the box are 0’s and 1’s! • In fact, we don’t even need to know what is in the box, we just need to know the average and the SD of the box.
Example 1. HANES women 18-24 have an average height of 64.3” with an SD of 2.6”. Suppose we take a random sample of 100 of these women. What is the expected value of the average height of the women in the sample? It’s SE?
As with the percentage, multiplying the number of draws by some number divides the SEave by the square root of that number. e.g. for 100 women, SEave = .26 for 400 women, SEave = .13 for 900 women, SEave = .087
Example 2. HANES women 18-24 have an average height of 64.3” with an SD of 2.6”. Suppose we take a random sample of 100 of these women. a) What’s the chance the sample average will be more than 64.5”? b) What percentage of the women are taller than 64.5”?
Example 3. For a certain gas station, the average amount of gas sold is 9.84 gallons, with an SD of 3.92 gallons. If we take a simple random sample of 100 purchases from this gas station, what is the chance that the average amount of gas for these 100 purchases is more than 10 gallons?
Example 3a. For a large population of fulltime workers, the average income is $32,500 with an SD of $20,000. a) If I take a simple random sample of 400 of these workers, what is the chance the average income for my sample is more than $35,000? b) Do I need to know the incomes follow the normal curve? c) Can we figure out what percentage of the incomes are greater than $35,000?
The Bootstrap When we do not know what is in the box, we estimate the SD of the box by the SD of the sample. Confidence Intervals A 95% confidence interval for the population average is given by Sample average ± 2(SE ave ) The confidence interval is valid if the number of draws is large enough.
Example 4. A lake contains a large number of fish of a particular type. A simple random sample of 300 of these fish gives an average weight of 4.13 pounds with an SD of 2.1 pounds. Find a 95% confidence interval for the average weight of all the fish in the lake.
Example 5. A nutrition student takes a simple random sample of 100 people from a large population and carefully monitors their caloric intake for 1 day. The average caloric intake is 2000, with an SD of 400. a) Find a 95% confidence interval for the average caloric intake for the population. b) Is your confidence interval valid if the histogram for caloric intake is not normal?
Example 6. A university has 12,000 students. A simple random sample of 500 students has average age 22.3 years with an SD of 4.1 years. Find a 90% confidence interval for the average age of all students at the university.
Reminder Normal curve calculations, including confidence intervals, are valid if the number of draws is large enough. How large is “large enough”? It depends on the box. If the box is a long way from normal (e.g. a box with lots of 0s and very few 1s) then the number of draws needs to be quite large.
Recommend
More recommend