2017 Water Cruise: Update on Copper dataset and Rolling Averages - - PowerPoint PPT Presentation

2017 water cruise
SMART_READER_LITE
LIVE PREVIEW

2017 Water Cruise: Update on Copper dataset and Rolling Averages - - PowerPoint PPT Presentation

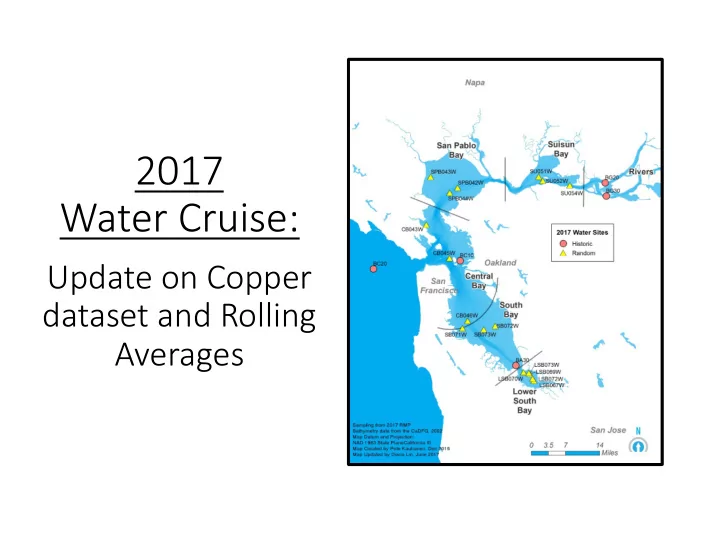
2017 Water Cruise: Update on Copper dataset and Rolling Averages Calculating 3-Event Rolling Averages As part of the site-specific objectives (SSO), NPDES dischargers are required to calculate the 3-event rolling average of dissolved


slide-1
SLIDE 1

2017 Water Cruise:

Update on Copper dataset and Rolling Averages

slide-2
SLIDE 2

Calculating 3-Event Rolling Averages

  • As part of the site-specific objectives (SSO), NPDES dischargers

are required to calculate the 3-event rolling average of dissolved copper and total cyanide concentrations in each segment of the Bay, based on RMP data

  • Data from the last three

RMP water cruises (2013, 2015, and 2017) were used to update the averages

slide-3
SLIDE 3

2017 Cu Dataset Summary

  • December ‘17: Ila presented preliminary copper results &

rolling averages

  • Results were using Brooks new ion column preparation method
  • Concentrations were ~20% higher and approaching triggers
  • Don mentioned possible issue with new Brooks Cu method
  • Don worked with Brooks in 2018 to determine the issue with

the IP method (interference from Ti species)

  • Brooks re-ran samples using the IP and older, reductive

precipitation (“RP”) method

  • September ‘18: Don & TRC decided to publish results using the

RP method

slide-4
SLIDE 4

# Sites With Results by Year & Region

Copper

(dissolved)

*Historical station BC10 included; **Historical station BA30 included

Suisun Bay San Pablo Bay *Central Bay **South Bay Lower South Bay 2013

3 3 4 4 5

2015

3 3 4 4 5

2017

3 3 3 4 5

Total Samples in Rolling Average

9 9 11 12 15

slide-5
SLIDE 5

Copper Results

  • Copper rolling averages are below the trigger level (TL) in all

regions

  • Averages either stayed the same (1 region) or decreased
  • Region closest to SSO (Suisun Bay) decreased 0.2 μg/L

FINAL DATA

Region Copper SSO (μg/L) Copper TL (μg/L) Previous Average (μg/L) (2011, 2013, 2015) Current Average (μg/L) (2013, 2015, 2017) Δ Rolling Average Distance From TL Suisun Bay 6.0 2.8 2.29

2.10

  • 0.19

0.70

San Pablo Bay 6.0 3 2.00

1.81

  • 0.19

1.19

Central Bay 6.0 2.2 1.45

1.46 0.01 0.74

South Bay 6.9 3.6 2.77

2.37

  • 0.40

1.23

Lower South Bay 6.9 4.2 3.62

3.04

  • 0.58

1.16

slide-6
SLIDE 6

Trend in Copper Rolling Average

1 1.5 2 2.5 3 3.5 4 4.5 2010, 2011, 2013 2011, 2013, 2015 2013, 2015, 2017 Copper Concentration (μg/L) 3-Event Rolling Averages

Suisun Bay San Pablo Bay Central Bay South Bay Lower South Bay Trigger Level Trigger Level Trigger Level Trigger Level Trigger Level

slide-7
SLIDE 7

Copper Results vs Trigger

Trigger Level Current Average

slide-8
SLIDE 8

LSB Cu vs & Guadalupe Flow