
XL2B: Excel2013: Model Trendline Multi 4/05/2019 V0P www.StatLit.org/pdf/Excel2013-Model-Trendline-Multi-slides.pdf
Excel2013 Model Trendline Multi XL2B: V0P1
by Milo Schield Fellow: American Statistical Association Member: International Statistical Institute US Rep: International Statistical Literacy Project
Materials at: www.StatLit.org/ pdf/Excel2013-Model-Trendline-Multi-Slides.pdf Excel/Pulse.xls
Model Using Trendline Multiple Models in Excel 2013
Excel2013 Model Trendline Multi XL2B: V0P2
Assignment:
- 1. Goal: Generate six charts. Use different models of the
association between two variables (slides 6-11).
- 2. Six models: linear with forecast, linear with zero
intercept, polynomial, logarithmic, power & exponential.
- 3. For each chart, show trend-line, regression equation and
- R2. Show title and axis headings for all
- 4. No description of association (trend) is required.
No comparison of fit is required (See slide 12) Get data at www.StatLit.org/Excel/pulse.xls To review using Trendline, see www.StatLit.org/pdf/
Excel2013-Model-Trendline-Linear-Slides.pdf
Excel2013 Model Trendline Multi XL2B: V0P3
Process Advice
1.Create first XY chart: Weight (Y), Height (X) 2.Format Y axis [Min, Max]: [90, 230] 3.Add axis titles and chart title. Create trendline, equation and R-squared. Format as needed. Line can be solid or dashed 4.Copy + paste this graph to create next graph.
- 5. Delete old trendline; Modify as needed.
Step 4 saves time: skips repeating first 3 steps.
Excel2013 Model Trendline Multi XL2B: V0P4
Algebraic Models
1) Linear: Y=a+bx. Linear with prediction 2) Linear: Y = bx. Linear with zero intercept 3) Polynomial: Y= a+bx+cx2+dx3 . Multi-curves 4) Logarithmic: Y=a*Ln(x) + b. 100/10 = 10/1 Log10(1) = 0; Log10(10) = 1; Log10(100) = 2 Log(100)-Log(10)=Log(10)-Log(1) 5) Power model: Y=axb [Between log & exp.] 6) Exponential: Y=aex/b. Constant rate of change
Excel2013 Model Trendline Multi XL2B: V0P5
To create each graph, use Trendline: “More Options” .
Select ‘+’: Chart Elements Do not check Trendline box At Trendline, press right arrow Select More Options Select Algebraic model Check Equation & R-square [Check Forecast or Intercept]
1,2 3 4 5 2 1 All 6
Excel2013 Model Trendline Multi XL2B: V0P6
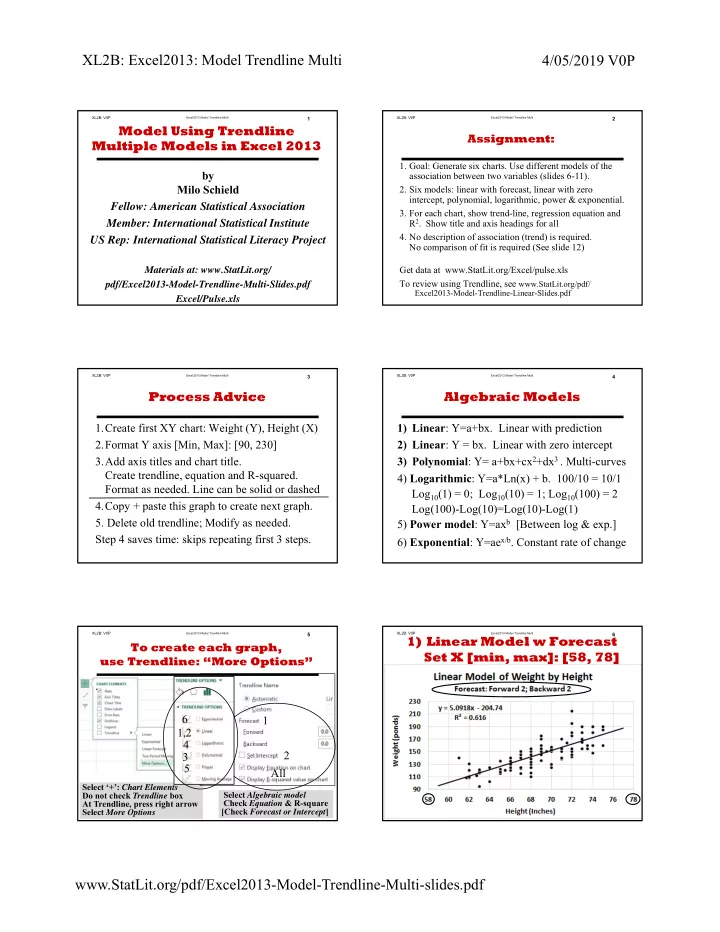
1) Linear Model w Forecast Set X [min, max]: [58, 78]