excel2013 model toolpak regress xl3b v0u 12 06 2017 2
play

Excel2013 Model Toolpak Regress XL3B:V0U 12/06/2017 2 Predictors: - PDF document

Excel2013 Model Toolpak Regress XL3B:V0U 12/06/2017 2 Predictors: Binary+Continuous XL3B: V0U XL3B: V0U Excel2013 Model Toolpak Regress2 Binary&Continous 1 Excel2013 Model Toolpak Regress2 Binary&Continous 2 Regress Linear Two


  1. Excel2013 Model Toolpak Regress XL3B:V0U 12/06/2017 2 Predictors: Binary+Continuous XL3B: V0U XL3B: V0U Excel2013 Model Toolpak Regress2 Binary&Continous 1 Excel2013 Model Toolpak Regress2 Binary&Continous 2 Regress Linear Two Predictor Weight-Height association Binary+Continuous Excel 2013 before/after control for Gender Required output: Create and upload your worksheet: by 1. Calculate mean height and weight by gender: slide 3 Milo Schield 2. Model Weight on Height and Gender: slides 6 & 7. Member: International Statistical Institute 3. Generate height-weight chart with trendline: slide 8.* US Rep: International Statistical Literacy Project 4. Graph output from multiple regression: slide 12.* Director, W. M. Keck Statistical Literacy Project Show regress lines for men and women separately. * Show equation and R-square on both graphs. Materials at: www.StatLit.org/pdf/ Data: www.StatLit.org/xls/ Excel2013-Model-Toolpak-Regress2BC-Slides.pdf Excel2013-Model-Toolpak-Regress2BC-Input.xlsx Excel2013-Model-Toolpak-Regress2BC-Output.pdf Subjects are college students. Male : 1 for guys; 0 for gals. XL3B: V0U Excel2013 Model Toolpak Regress2 Binary&Continous 3 XL3B: V0U Excel2013 Model Toolpak Regress2 Binary&Continous 4 1) Analyze Data: 2a) Data Toolbar, select Data Analysis. Select Regression Enter Formula into K4:L5 . See slide 17 if no Data Analysis on your toolbar. Actual male-female differences : • Average weight: 158.3 - 123.8 = 34.5 pounds • Average height: 70.75 – 65.40 = 5.35 inches Question: How much of the male-female weight difference (34.5#) is due to gender (male vs. female) and how much is due to the difference in heights? Analyzing a whole into parts is called “decomposition”. XL3B: V0U Excel2013 Model Toolpak Regress2 Binary&Continous 5 XL3B: V0U Excel2013 Model Toolpak Regress2 Binary&Continous 6 2b) Regress Weight (E1:E93) 2c) Results: Regress Weight on Height and Sex (C1:D93) on Height and Sex (Male?) . Obtain R-sq here Formatting and formula are optional Obtain best-fit Two coefficients here columns Weight = -117.6 + (3.69*Height) + (14.7*Male) . Excel2013-Model-Toolpak-Regress2BC-Slides.pdf 1

  2. Excel2013 Model Toolpak Regress XL3B:V0U 12/06/2017 2 Predictors: Binary+Continuous XL3B: V0U XL3B: V0U Excel2013 Model Toolpak Regress2 Binary&Continous 7 Excel2013 Model Toolpak Regress2 Binary&Continous 8 3) Create 2d) Calculate Expected Weight at High+Low Heights for Guys+Gals Chart #1 Create formula in L33 predicting weight: Pull L33 down to L36 XL3B: V0U Excel2013 Model Toolpak Regress2 Binary&Continous 9 XL3B: V0U Excel2013 Model Toolpak Regress2 Binary&Continous 10 4a) Copy & Paste Chart 1. 4b) Select Data. Add two series: One for Gals and one for Guys Delete Trend, Equation & R 2 . . XL3B: V0U Excel2013 Model Toolpak Regress2 Binary&Continous 11 XL3B: V0U Excel2013 Model Toolpak Regress2 Binary&Continous 12 4c) Select top/guys data point. 4d) Insert text boxes for Male, Format data series/Paint/Line/Solid Female and Equation with R 2 Repeat for bottom/gals data point. . To select: Point . and right mouse Insert textbox above. Get equation & R-sq from slide 6. Excel2013-Model-Toolpak-Regress2BC-Slides.pdf 2

  3. Excel2013 Model Toolpak Regress XL3B:V0U 12/06/2017 2 Predictors: Binary+Continuous XL3B: V0U XL3B: V0U Excel2013 Model Toolpak Regress2 Binary&Continous 13 Excel2013 Model Toolpak Regress2 Binary&Continous 14 If + Sign doesn’t appear on Appendix upper-right side of graph… Slide 16: What to do if the plus sign doesn’t Select the graph. Select the Chart-Tools Design tab. appear on the upper-right side of the graph Slides 17 & 18: What to do if the Data Analysis object doesn’t appear on the right side of the At the far-left, select “Add Chart Element”. Data toolbar. Select “Axis Titles” and “Chart Title”. To add a Trendline, either select “Trendline” under “Add Chart Element” or right-mouse on a data point and select Trendline from menu. XL3B: V0U Excel2013 Model Toolpak Regress2 Binary&Continous 15 XL3B: V0U Excel2013 Model Toolpak Regress2 Binary&Continous 16 If Data Analysis doesn’t Add Data Analysis appear on Data Toolbar to the Data Toolbar 1) Select File/Options. 2) Select Add-Ins. 1) Checks the boxes involving Analysis ToolPak. 2) Press OK 3) In the lower-left corner next to Manage, select Excel Add-Ins. 4) Press GO. XL3B: V0U Excel2013 Model Toolpak Regress2 Binary&Continous 17 XL3B: V0U Excel2013 Model Toolpak Regress2 Binary&Continous 18 4c2) After Adding Two New 4b2) Select Data; Select “Add” Series, Press “OK” . . Excel2013-Model-Toolpak-Regress2BC-Slides.pdf 3

  4. XL3B: V0U Excel2013 Model Toolpak Regress2 Binary&Continous 1 
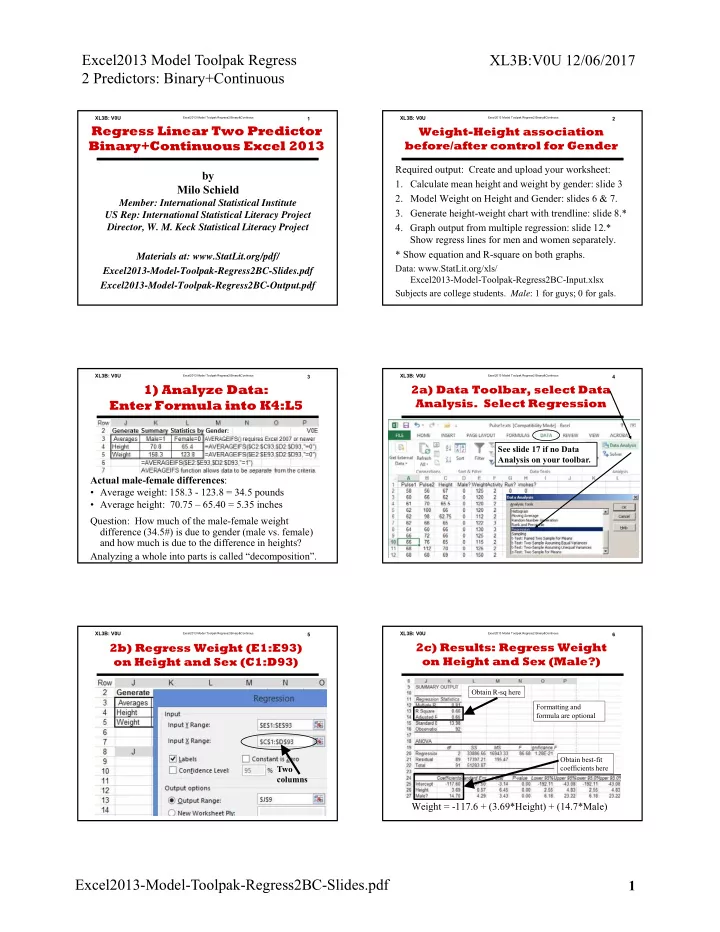
Regress Linear Two Predictor Binary+Continuous Excel 2013 by Milo Schield Member: International Statistical Institute US Rep: International Statistical Literacy Project Director, W. M. Keck Statistical Literacy Project Materials at: www.StatLit.org/pdf/ Excel2013-Model-Toolpak-Regress2BC-Slides.pdf Excel2013-Model-Toolpak-Regress2BC-Output.pdf

  5. XL3B: V0U Excel2013 Model Toolpak Regress2 Binary&Continous 2 Weight-Height association before/after control for Gender Required output: Create and upload your worksheet: 1. Calculate mean height and weight by gender: slide 3 2. Model Weight on Height and Gender: slides 6 & 7. 3. Generate height-weight chart with trendline: slide 8.* 4. Graph output from multiple regression: slide 12.* Show regress lines for men and women separately. * Show equation and R-square on both graphs. Data: www.StatLit.org/xls/ Excel2013-Model-Toolpak-Regress2BC-Input.xlsx Subjects are college students. Male : 1 for guys; 0 for gals.

  6. XL3B: V0U Excel2013 Model Toolpak Regress2 Binary&Continous 3 1) Analyze Data: Enter Formula into K4:L5 Actual male-female differences : • Average weight: 158.3 - 123.8 = 34.5 pounds • Average height: 70.75 – 65.40 = 5.35 inches Question: How much of the male-female weight difference (34.5#) is due to gender (male vs. female) and how much is due to the difference in heights? Analyzing a whole into parts is called “decomposition”.

  7. XL3B: V0U Excel2013 Model Toolpak Regress2 Binary&Continous 4 2a) Data Toolbar, select Data Analysis. Select Regression . See slide 17 if no Data Analysis on your toolbar.

  8. XL3B: V0U Excel2013 Model Toolpak Regress2 Binary&Continous 5 2b) Regress Weight (E1:E93) on Height and Sex (C1:D93) . Two columns

  9. XL3B: V0U Excel2013 Model Toolpak Regress2 Binary&Continous 6 2c) Results: Regress Weight on Height and Sex (Male?) Obtain R-sq here Formatting and formula are optional Obtain best-fit coefficients here Weight = -117.6 + (3.69*Height) + (14.7*Male) .

  10. XL3B: V0U Excel2013 Model Toolpak Regress2 Binary&Continous 7 2d) Calculate Expected Weight at High+Low Heights for Guys+Gals Create formula in L33 predicting weight: Pull L33 down to L36

  11. XL3B: V0U Excel2013 Model Toolpak Regress2 Binary&Continous 8 3) Create Chart #1

  12. XL3B: V0U Excel2013 Model Toolpak Regress2 Binary&Continous 9 4a) Copy & Paste Chart 1. Delete Trend, Equation & R 2 .

  13. XL3B: V0U Excel2013 Model Toolpak Regress2 Binary&Continous 10 4b) Select Data. Add two series: One for Gals and one for Guys .

  14. XL3B: V0U Excel2013 Model Toolpak Regress2 Binary&Continous 11 4c) Select top/guys data point. Format data series/Paint/Line/Solid Repeat for bottom/gals data point. . To select: Point and right mouse

  15. XL3B: V0U Excel2013 Model Toolpak Regress2 Binary&Continous 12 4d) Insert text boxes for Male, Female and Equation with R 2 . Insert textbox above. Get equation & R-sq from slide 6.

  16. XL3B: V0U Excel2013 Model Toolpak Regress2 Binary&Continous 13 Appendix Slide 16: What to do if the plus sign doesn’t appear on the upper-right side of the graph Slides 17 & 18: What to do if the Data Analysis object doesn’t appear on the right side of the Data toolbar.

  17. XL3B: V0U Excel2013 Model Toolpak Regress2 Binary&Continous 14 If + Sign doesn’t appear on upper-right side of graph… Select the graph. Select the Chart-Tools Design tab. At the far-left, select “Add Chart Element”. Select “Axis Titles” and “Chart Title”. To add a Trendline, either select “Trendline” under “Add Chart Element” or right-mouse on a data point and select Trendline from menu.

  18. XL3B: V0U Excel2013 Model Toolpak Regress2 Binary&Continous 15 If Data Analysis doesn’t appear on Data Toolbar 1) Select File/Options. 2) Select Add-Ins. 3) In the lower-left corner next to Manage, select Excel Add-Ins. 4) Press GO.

  19. XL3B: V0U Excel2013 Model Toolpak Regress2 Binary&Continous 16 Add Data Analysis to the Data Toolbar 1) Checks the boxes involving Analysis ToolPak. 2) Press OK

  20. XL3B: V0U Excel2013 Model Toolpak Regress2 Binary&Continous 17 4b2) Select Data; Select “Add” .

  21. XL3B: V0U Excel2013 Model Toolpak Regress2 Binary&Continous 18 4c2) After Adding Two New Series, Press “OK” .

Download Presentation
Download Policy: The content available on the website is offered to you 'AS IS' for your personal information and use only. It cannot be commercialized, licensed, or distributed on other websites without prior consent from the author. To download a presentation, simply click this link. If you encounter any difficulties during the download process, it's possible that the publisher has removed the file from their server.

Recommend


More recommend