
2015 Schield Logistic MLE1C Excel2013 8/18/2016 V0D 2015-Schield-Logistic-MLE1C-Excel2013-Slides.pdf 1
2015 Schield Logistic MLE 1C Excel2013 SlidesV0D 1
by Milo Schield
Member: International Statistical Institute US Rep: International Statistical Literacy Project Director, W. M. Keck Statistical Literacy Project Slides and data at: www.StatLit.org/ pdf/2015-Schield-Logistic-MLE1C-Excel2013-Demo.pdf pdf/2015-Schield-Logistic-MLE1C-Excel2013-Slides.pdf xls/2015-Schield-Logistic-MLE1C-Excel2013-Data.xlsx
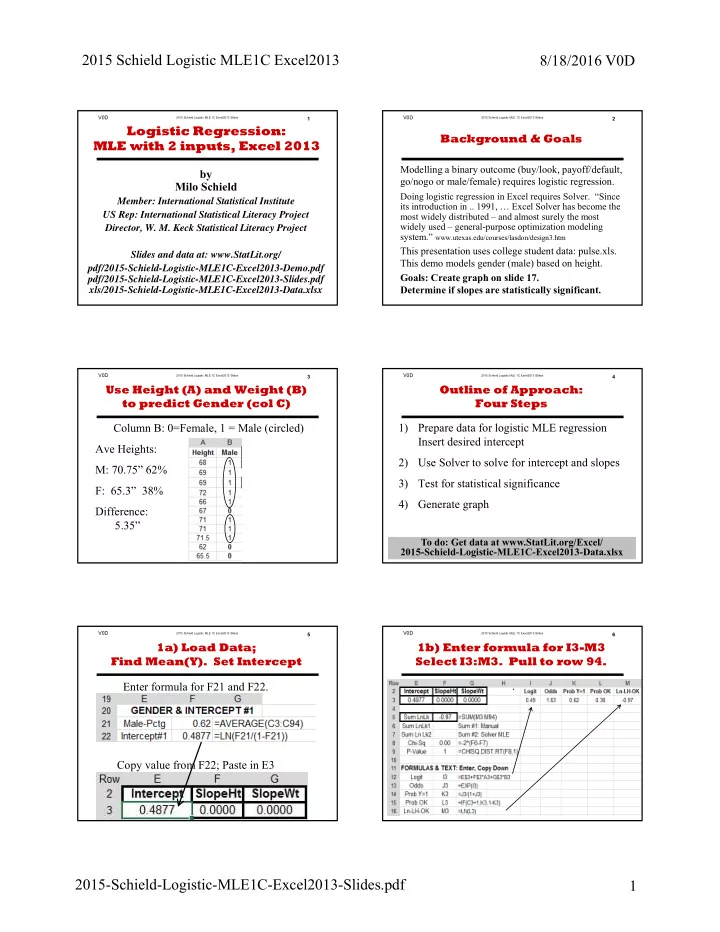
Logistic Regression: MLE with 2 inputs, Excel 2013
2015 Schield Logistic MLE 1C Excel2013 SlidesV0D 2
Background & Goals
Modelling a binary outcome (buy/look, payoff/default, go/nogo or male/female) requires logistic regression.
Doing logistic regression in Excel requires Solver. “Since its introduction in .. 1991, … Excel Solver has become the most widely distributed – and almost surely the most widely used – general-purpose optimization modeling system.” www.utexas.edu/courses/lasdon/design3.htm
This presentation uses college student data: pulse.xls. This demo models gender (male) based on height. Goals: Create graph on slide 17. Determine if slopes are statistically significant.
2015 Schield Logistic MLE 1C Excel2013 SlidesV0D
Column B: 0=Female, 1 = Male (circled) Ave Heights: M: 70.75” 62% F: 65.3” 38% Difference: 5.35”
3
Use Height (A) and Weight (B) to predict Gender (col C)
2015 Schield Logistic MLE 1C Excel2013 SlidesV0D
1) Prepare data for logistic MLE regression Insert desired intercept 2) Use Solver to solve for intercept and slopes 3) Test for statistical significance 4) Generate graph
4
Outline of Approach: Four Steps
To do: Get data at www.StatLit.org/Excel/ 2015-Schield-Logistic-MLE1C-Excel2013-Data.xlsx
2015 Schield Logistic MLE 1C Excel2013 SlidesV0D 5
1a) Load Data; Find Mean(Y). Set Intercept Enter formula for F21 and F22. Copy value from F22; Paste in E3
2015 Schield Logistic MLE 1C Excel2013 SlidesV0D 6
1b) Enter formula for I3-M3 Select I3:M3. Pull to row 94. .