SLIDE 4 Why are Polls So Wrong? CTC1-1A 4 Dec, 2016 2016-Schield-CTC1-Slides.pdf 4
2016 Schield CTC1
1A 19
- 6. State Error is Typically
More than National Error
.
95% Margin of Error: 4.8 Points
2016 Schield CTC1
1A 20
more ‘Art” than ‘Science”
We gave some good pollsters the same data. They gave very different results!!!
2016 Schield CTC1
1A 21
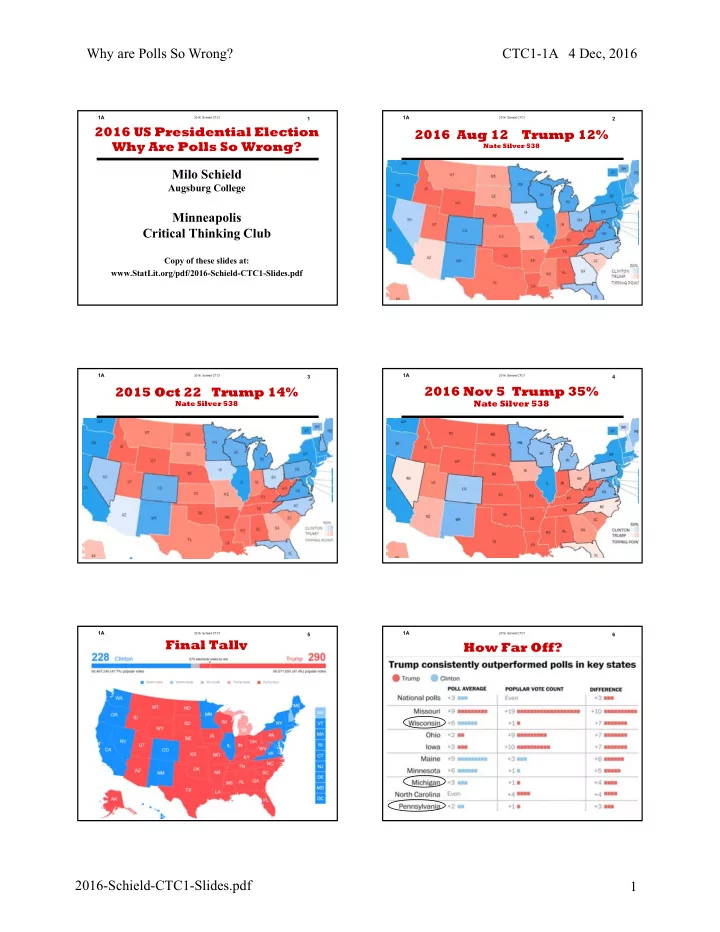
Nate Silver (11/08) predicted a 3.6 point margin for Hillary:
- Clinton: 48.5% Johnson 5.0%
- Trump: 44.9% Other: 0.6%
http://projects.fivethirtyeight.com/2016-election-forecast/?ex_cid=rrpromo
In fact, Hillary “won” by at least a 1.3 point margin:
- Clinton: 48.0% Other: 5.3%
- Trump: 46.7%
http://cookpolitical.com/story/10174
Readers are guilty of selection bias;
- Inferring Electoral-College win from Popular-Vote win.
- 7. Selection Bias.
National Polls were OK
2016 Schield CTC1
1A 22
Election polls are closer to fortune telling to facts. Election polls are different (very different) from surveys!
Surveys report! Election polls predict.
Surveys never (almost) adjust. Election polls always adjust Polls have to adjust
- to match the profile of those that will vote.
- for (how to allocate) the undecided.
- the non-response bias.
Conclusion
2016 Schield CTC1
1A 23
.
Conclusion
2016 Schield CTC1
1A 24 www.bloomberg.com/news/videos/2016-10-13/can-halloween-masks-predict-the-winner-of-the-election.
Best Predictor? Halloween Mask Sales