Whats wrong with the What s wrong with the What s wrong with the - - PowerPoint PPT Presentation

what s wrong with the what s wrong with the what s wrong
SMART_READER_LITE
LIVE PREVIEW

Whats wrong with the What s wrong with the What s wrong with the - - PowerPoint PPT Presentation

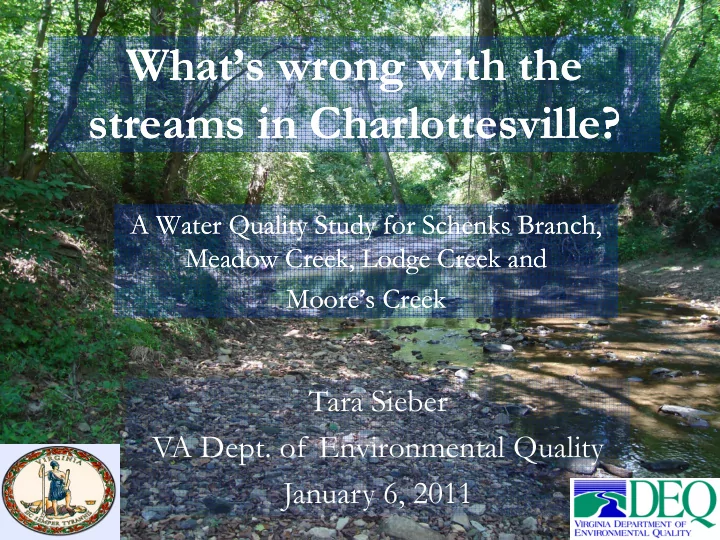
Whats wrong with the What s wrong with the What s wrong with the Whats wrong with the streams in Charlottesville? streams in Charlottesville? A Water Quality Study for A Water Quality Study for A Water Quality Study for Schenks A


slide-1
SLIDE 1

What’s wrong with the What’s wrong with the What s wrong with the What s wrong with the streams in Charlottesville? streams in Charlottesville?

A Water Quality Study for A Water Quality Study for Schenks Schenks Branch Branch A Water Quality Study for A Water Quality Study for Schenks Schenks Branch, Branch, Meadow Creek, Lodge Creek and Meadow Creek, Lodge Creek and Moore’s Creek Moore’s Creek

Tara Sieber VA Dept. of Environmental Quality p Q y January 6, 2011

slide-2
SLIDE 2

Why are we here? Why are we here? Why are we here? Why are we here?

What’s wrong with

What’s wrong with

What s wrong with

What s wrong with Charlottesville’s Charlottesville’s Streams? Streams? Streams? Streams?

What’s being done?

What’s being done? Wh d ? Wh d ?

What can you do?

What can you do?

How does this impact

How does this impact the Chesapeake Bay? the Chesapeake Bay?

Exhibits

Exhibits

slide-3
SLIDE 3

Lodge Creek

slide-4
SLIDE 4

What’s wrong with What’s wrong with Charlottesville’s streams? Charlottesville’s streams?

Meadow Creek

Meadow Creek

Meadow Creek

Meadow Creek and Moore’s and Moore’s Creek have too Creek have too Creek have too Creek have too much bacteria much bacteria

Do not meet

Do not meet

Do not meet

Do not meet water quality water quality standards = standards = standards = standards = “impaired impaired”

slide-5
SLIDE 5

What has been done? What has been done? What has been done? What has been done?

Source: Rivanna River Bacteria TMDL

Meadow Creek was

Meadow Creek was included in the included in the included in the included in the Rivanna Rivanna River River Bacteria water Bacteria water Bacteria water Bacteria water quality study quality study (TMDL) completed (TMDL) completed (TMDL) completed (TMDL) completed in 2008 in 2008-

  • 2009

2009

slide-6
SLIDE 6

What has been done? What has been done? What has been done? What has been done?

Moore’s Creek had a water quality

Moore’s Creek had a water quality study/TMDL for bacteria completed in 2002 study/TMDL for bacteria completed in 2002

Implementation Plan completed in 2005

Implementation Plan completed in 2005 p p p p

S r M r ’ Source: Moore’s Creek Bacteria TMDL

slide-7
SLIDE 7

What’s wrong with What’s wrong with Charlottesville’s streams? Charlottesville’s streams?

Biological monitoring reveals

Biological monitoring reveals g g g g these streams do not support these streams do not support healthy and diverse aquatic healthy and diverse aquatic community community community community

Biologists look at the Benthic

Biologists look at the Benthic Macroinvertebrates = Macroinvertebrates = BUGS BUGS

Numbers and types collected

Numbers and types collected are compared to a healthy are compared to a healthy reference condition reference condition reference condition reference condition

Stream given a Stream

Stream given a Stream Condition Index (SCI) score Condition Index (SCI) score ( ) ( ) SCI of <60 = Aquatic Life SCI of <60 = Aquatic Life (Benthic) Impairment (Benthic) Impairment

slide-8
SLIDE 8

Lodge Creek

slide-9
SLIDE 9

Why Do We Care About Why Do We Care About “B ”? “B ”? “Bugs”? “Bugs”?

Important food source for fish

Important food source for fish p

Important in cycling nutrients

Important in cycling nutrients

G

d i di t f p ll t t d G d i di t f p ll t t d

Good indicators of pollutants and

Good indicators of pollutants and

  • verall stream health
  • verall stream health

H l h H l h U h lth U h lth Healthy Healthy Unhealthy Unhealthy

slide-10
SLIDE 10

What are the scores for What are the scores for Charlottesville’s streams? Charlottesville’s streams?

100 80 90 100 50 60 70

nia SCI

2‐MSC000.60 2‐XRC001.15 2‐MWC000.60

Moore’s Creek (MSC) Lodge Creek (XRC) Meadow Creek (MWC)

Healthy Unhealthy

20 30 40

Virgi

2 MWC000.60 2‐SNK000.88 2‐XSN000.08 2 XSN000 18

Meadow Creek (MWC) Schenks Branch (SNK) Unnamed Trib (XSN)

10 20 2‐XSN000.18 Jan‐04 Jan‐05 Jan‐06 Jan‐07 Jan‐08 Jan‐09 Jan‐10

Graph Source: VT-BSE 2011

slide-11
SLIDE 11

Monitoring Stations Monitoring Stations

Map Source: VT-BSE 2011

slide-12
SLIDE 12

What is being done? What is being done? What is being done? What is being done?

A TMDL is formally known as

A TMDL is formally known as A TMDL is formally known as A TMDL is formally known as a a T Total

  • tal M

Maximum aximum D Daily aily L Load

  • ad

– or the amount of pollution

  • r the amount of pollution

p that a stream can receive but that a stream can receive but still maintain water quality still maintain water quality d d d d standards standards

A pollution “diet” or “budget”

A pollution “diet” or “budget” to acco nt for all so rces of to acco nt for all so rces of to account for all sources of to account for all sources of pollution to a stream pollution to a stream

Recommends reductions from

Recommends reductions from Recommends reductions from Recommends reductions from the sources to meet the limit the sources to meet the limit

slide-13
SLIDE 13

The TMDL Process The TMDL Process

Total

  • Identifies sources of pollution

Total Maximum Daily

Virginia’s process to improve streams

Implementation Plan

  • Calculates amounts from each

source

  • Estimates necessary pollutant

reductions

y

Load

Study

reductions

  • Identifies permit

controls or best t ti

I l i Monitoring Polluted

management practices needed to make necessary pollutant reductions

Implementation Cl

Water quality standards met

Clean

Water quality standards not met

slide-14
SLIDE 14

Study Step #1: Study Step #1: What is affecting the bugs? What is affecting the bugs?

Perform a “Stressor Identification Analysis”

Perform a “Stressor Identification Analysis”

Perform a Stressor Identification Analysis

Perform a Stressor Identification Analysis

Look at all possible stressors using a weight

Look at all possible stressors using a weight-

  • of
  • f-
  • evidence approach

evidence approach evidence approach evidence approach

Historical and recently collected data

Historical and recently collected data B i h bi li di B i h bi li di

Bug community, habitat, water quality, sediment, etc.

Bug community, habitat, water quality, sediment, etc.

Non stressors Possible Most probable Non-stressors stressors stressors

slide-15
SLIDE 15

Non Non-Stressors Stressors Non Non Stressors Stressors

Ammonia

Ammonia

Ammonia

Ammonia

Metals

Metals H

pH

pH

Temperature

Temperature

Total Dissolved

Total Dissolved Solids/Conductivity Solids/Conductivity / y / y

slide-16
SLIDE 16

Possible Stressors Possible Stressors Possible Stressors Possible Stressors

Hydrologic

Hydrologic

Hydrologic

Hydrologic Modifications Modifications (Moore’s Creek) (Moore’s Creek) (Moore s Creek) (Moore s Creek)

Nutrients

Nutrients O i M O i M

Organic Matter

Organic Matter

PAHs

PAHs

Toxics

Toxics

slide-17
SLIDE 17

Most Probable Stressors Most Probable Stressors Most Probable Stressors Most Probable Stressors

(Preliminary Results – Analysis continuing)

M ' L d M d S h k Hydrologic modification X X X Most Probable Stressor Moore's Creek Lodge Creek Meadow Creek Schenks Branch Sediment X X X X

slide-18
SLIDE 18

Why do we care about Why do we care about

Habitat Changes impact aquatic life

Habitat Changes impact aquatic life

Hydrologic Modification? Hydrologic Modification?

Habitat Changes impact aquatic life

Habitat Changes impact aquatic life

Channel Alteration eliminates stream’s natural

Channel Alteration eliminates stream’s natural ability to absorb and recover from impacts (large ability to absorb and recover from impacts (large ability to absorb and recover from impacts (large ability to absorb and recover from impacts (large storms, sewer overflows, pollutants, etc.) storms, sewer overflows, pollutants, etc.)

Source: Flickr

slide-19
SLIDE 19

What is the evidence for What is the evidence for H d l i M difi i ? H d l i M difi i ? Hydrologic Modification? Hydrologic Modification?

High percentage

High percentage

High percentage

High percentage

  • f impervious
  • f impervious

surfaces surfaces surfaces surfaces

  • Lodge Creek:

Lodge Creek: 30 7% 30 7% 30.7% 30.7%

  • Meadow Creek:

Meadow Creek: 31 9% 31 9% 31.9% 31.9%

  • Schenks Branch:

Schenks Branch: 36 2% 36 2% 36.2% 36.2%

Map Source: VT-BSE 2011

slide-20
SLIDE 20

What is the evidence for What is the evidence for Hydrologic Modification? Hydrologic Modification?

Channelized stream

Channelized stream

Channelized stream

Channelized stream segments ( segments (Schenks Schenks Branch Branch)

Sewer system

Sewer system

  • verflows (Lodge
  • verflows (Lodge

www.raleighnc.gov

  • verflows (Lodge
  • verflows (Lodge

Creek) Creek)

slide-21
SLIDE 21

Why do we care about Sediment? Why do we care about Sediment? Why do we care about Sediment? Why do we care about Sediment?

A healthy “bug” community requires a clean stream

A healthy “bug” community requires a clean stream bottom with lots of space between rocks and gravels bottom with lots of space between rocks and gravels bottom with lots of space between rocks and gravels bottom with lots of space between rocks and gravels

Healthy Stream Bottom Excess Sediment

slide-22
SLIDE 22

What is the evidence for Sediment? What is the evidence for Sediment? What is the evidence for Sediment? What is the evidence for Sediment?

Channel Erosion Fine sediment on bottom of streams

slide-23
SLIDE 23

Study Step #2: Study Step #2: Id tif S Id tif S Identify Sources Identify Sources

Source: Kate Harrigan, DEQ Source: raleighnc.gov

?

slide-24
SLIDE 24

What Can You Do to Help? What Can You Do to Help? What Can You Do to Help? What Can You Do to Help?

Participate on the Technical

p Advisory Committee

Group of local citizens,

l d r r iz ti d landowners, organizations, and government entities that will provide input, review and i t t DEQ d assistance to DEQ and contractors during development

  • f the TMDL Study

Goal - make sure technical

aspects of the study are accurate as well as acceptable to the community

slide-25
SLIDE 25

What Can You Do to Help? What Can You Do to Help? What Can You Do to Help? What Can You Do to Help?

Small Actions make a

Small Actions make a Small Actions make a Small Actions make a BIG Difference! BIG Difference!

Rainbarrels

Rainbarrels

Raingardens

Raingardens

Plant trees along streams

Plant trees along streams & bili b k & bili b k & stabilize banks & stabilize banks

Fence cattle out of

Fence cattle out of streams streams streams streams

Fertilize lawn once a year

Fertilize lawn once a year

Pick up after pets

Pick up after pets

slide-26
SLIDE 26

TMDL Timeline TMDL Timeline TMDL Timeline TMDL Timeline

2006

2006-

  • 2008

2008 – Streams included on “dirty waters Streams included on “dirty waters list” for aquatic life standard list” for aquatic life standard

October 2010

October 2010 – DEQ and VT begin the TMDL DEQ and VT begin the TMDL Q g Q g process by informing partners process by informing partners

January 6, 2011

January 6, 2011 – First Public Meeting First Public Meeting January 6, 2011 January 6, 2011 First Public Meeting First Public Meeting

Spring 2011

Spring 2011 – – Technical Advisory Committee Technical Advisory Committee Meeting(s) Meeting(s) Meeting(s) Meeting(s)

Summer 2011

Summer 2011 – – Next Public Meeting and start of Next Public Meeting and start of the Clean the Clean up Plan process up Plan process the Clean the Clean-up Plan process up Plan process

slide-27
SLIDE 27

How does the Bay TMDL relate to cleaning up cleaning up

  • ur local waters?
slide-28
SLIDE 28

Low to no dissolved

  • xygen in the

yg Bay and tidal rivers every rivers every summer Decreasing SAV Aquatic life “impaired”

28

slide-29
SLIDE 29

Chesapeake Bay TMDL

EPA t ll ti di t t t

  • EPA sets pollution diet to meet

states’ Bay clean water standards with caps on nitrogen, phosphorus and nitrogen, phosphorus and sediment loads for all 6 Bay watershed states and DC

  • States set load caps for point

and non-point sources per major tributaries (e.g., James River)

  • Final Bay TMDL issued

December 29, 2010

  • 2-year milestones; 60%

achievement by 2017; all practices in place by 2025

29

slide-30
SLIDE 30

Bay and Local Pollution Diet Schedule

Major basin jurisdiction loading targets

Oct 2009

Final TMDL Established

December 2010

Bay TMDL Public Meetings

November- December 2009

Divide Target Loads among Watersheds, Counties, Sources

Phase 1 Watershed Implementation

Local Program Capacity/Gap Evaluation

2009 Phase 2 Watershed Implementation Plans:

Sources

p Plans: November 2009 – August 2010

Evaluation

Plans: Jan – Nov 2011

2-year milestones, reporting, modeling

Starting 2011 g

Public Review And Comment

August- October 2010

modeling, monitoring

slide-31
SLIDE 31

Virginia “segment-sheds” defined by Chesapeake Bay model Chesapeake Bay model

slide-32
SLIDE 32

Each locality will be given “t t l d ” f N P d di t “target loads” for N, P, and sediment in early 2011

slide-33
SLIDE 33

Each locality has discretion over how t t th “t t l d ” to meet these “target loads”

WLA = Waste Load Allocations set by permit for dischargers (point WLA = Waste Load Allocations, set by permit for dischargers (point sources such as waste treatment plants, MS4s) LA = Load Allocations (non-point source) reductions achieved through Best Management Practices (BMPs) such as

Virginia’s WIP provides for Virginia s WIP provides for

  • Trading between point sources, including between river basins

For example, between the James and York River basins

  • Trading between source sectors

g For example, between septic, agricultural, point sources

But …

slide-34
SLIDE 34

Local Water Quality Must Be Local Water Quality Must Be Protected or Maintained

slide-35
SLIDE 35
slide-36
SLIDE 36

Piedmont Regional Pilot Project

for the Chesapeake Bay TMDL (EPA)

  • Provide outreach to affected stakeholders:
  • Local governments
  • Agriculture
  • Builders/developers

P it h ld

  • Permit holders
  • Listen to concerns and obtain feedback
  • Ascertain support for developing a local/regional response
  • Overwhelming response:
  • Support for crafting a local plan
  • Readiness to have discussions across source sectors

Supervisor, Nelson County Th N t C Supervisor, Greene County CBP L l G t Ad i

Readiness to have discussions across source sectors

Steering Committee

The Nature Conservancy Rivanna River Basin Commission Southern Environmental Law Center Thomas Jefferson SWCD CBP Local Government Advisory Committee Culpeper SWCD Thomas Jefferson PDC

36

slide-37
SLIDE 37

The Chesapeake Bay TMDL (clean up plan) e C esapea e ay (c ea up p a ) will help us improve local water quality.

Resources for complying with Bay TMDL will Resources for complying with Bay TMDL will

positively affect local water quality.

Improvements, upgrades, retrofits locally can all Improvements, upgrades, retrofits locally can all

be “counted” towards local targets.

Charlottesville streams TMDL process and IP

p moves the community forward towards local and Bay water quality goals.

Both allow for the community to identify priorities

for achieving pollution reductions.

slide-38
SLIDE 38

Questions Questions Questions Questions

Tara Sieber Regional TMDL Coordinator VA-DEQ PO Box 3000 Harrisonburg, VA 22801 Tara Sieber@deq virginia gov Tara.Sieber@deq.virginia.gov 540.574.7870

Public Comment Period on this meeting extends until

Comments?

February 7, 2011. Let us know what you think!