V0D 2016 Classifying Studies V0D V0D 2016 Classifying Studies - - PDF document

v0d 2016 classifying studies
SMART_READER_LITE
LIVE PREVIEW

V0D 2016 Classifying Studies V0D V0D 2016 Classifying Studies - - PDF document

V0D 2016 Classifying Studies V0D V0D 2016 Classifying Studies 1 2016 Classifying Studies 2 Classifying Studies: Influences on Statistics Features and Benefits Typically, statistics are used as evidence for MILO SCHIELD, causal


slide-1
SLIDE 1

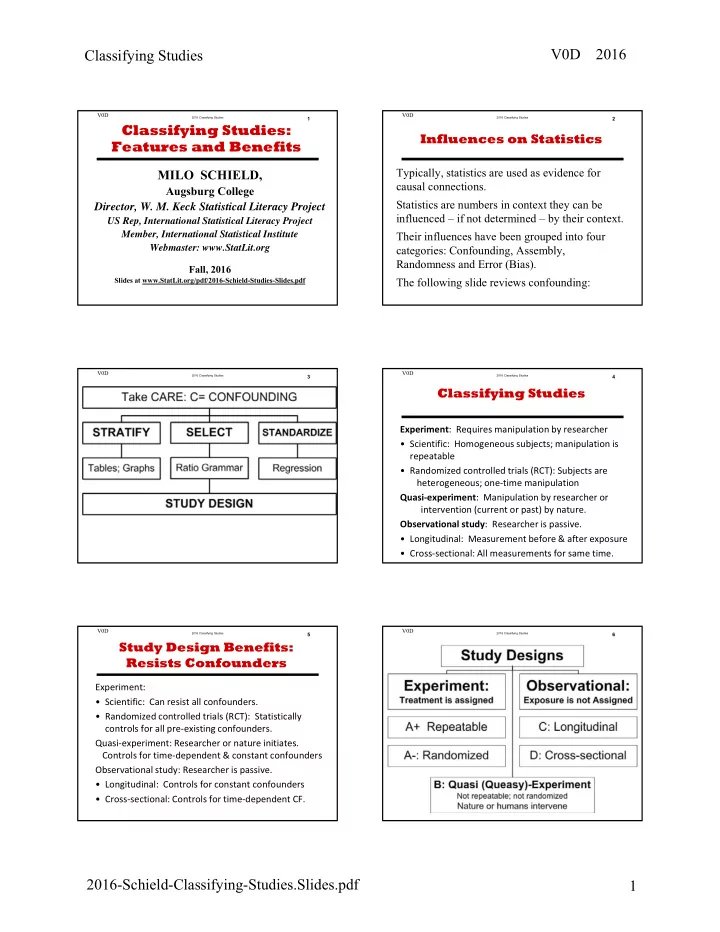
Classifying Studies V0D 2016 2016-Schield-Classifying-Studies.Slides.pdf 1

2016 Classifying Studies

V0D

1

MILO SCHIELD,

Augsburg College Director, W. M. Keck Statistical Literacy Project

US Rep, International Statistical Literacy Project Member, International Statistical Institute Webmaster: www.StatLit.org Fall, 2016

Slides at www.StatLit.org/pdf/2016-Schield-Studies-Slides.pdf

Classifying Studies: Features and Benefits

2016 Classifying Studies

V0D

2

Influences on Statistics

Typically, statistics are used as evidence for causal connections. Statistics are numbers in context they can be influenced – if not determined – by their context. Their influences have been grouped into four categories: Confounding, Assembly, Randomness and Error (Bias). The following slide reviews confounding:

2016 Classifying Studies

V0D

3

StatLit: Take CARE .

2016 Classifying Studies

V0D

4

Classifying Studies

Experiment: Requires manipulation by researcher

  • Scientific: Homogeneous subjects; manipulation is

repeatable

  • Randomized controlled trials (RCT): Subjects are

heterogeneous; one‐time manipulation Quasi‐experiment: Manipulation by researcher or intervention (current or past) by nature. Observational study: Researcher is passive.

  • Longitudinal: Measurement before & after exposure
  • Cross‐sectional: All measurements for same time.
2016 Classifying Studies

V0D

5

Study Design Benefits: Resists Confounders

Experiment:

  • Scientific: Can resist all confounders.
  • Randomized controlled trials (RCT): Statistically

controls for all pre‐existing confounders. Quasi‐experiment: Researcher or nature initiates. Controls for time‐dependent & constant confounders Observational study: Researcher is passive.

  • Longitudinal: Controls for constant confounders
  • Cross‐sectional: Controls for time‐dependent CF.
2016 Classifying Studies

V0D

6

Reading Graphs

.

slide-2
SLIDE 2

Classifying Studies V0D 2016 2016-Schield-Classifying-Studies.Slides.pdf 2

2016 Classifying Studies

V0D

7

Famous Science Experiments Galileo: Falling velocity ~ time-squared Harvey: Heart drives blood circulation Newton: White light is a combination of colors Lavoisier: Discovery of oxygen Faraday: Showed light was electro-magnetic Joule: Showed that heat was really motion

Source: www.telegraph.co.uk/news/science/science- news/3341042/Top-ten-greatest-experiments.html

2016 Classifying Studies

V0D

8

More Science Experiments: Repeatable .

2016 Classifying Studies

V0D

9

More Science Experiments: Density of Water vs. Temp .

2016 Classifying Studies

V0D

10

Randomized (Clinical) Trial: 1946: Salk Polio Vaccine Randomly assigned to second-graders.

2016 Classifying Studies

V0D

11

Observational Studies: 1948: Framingham Study MI =myocardial infraction (aka heart attack). Systolic/diastolic: 130/90

2016 Classifying Studies

V0D

12

Famous Quasi-Experiments: 1799: Bloodletting:

  • Dec. 13, 1799: George Washington awoke with a

bad sore throat and began to decline rapidly. He asked to be bled. Physicians drained an estimated 5 to 7 pints in less than 16 hours. Normal blood volume per adult is 8 to 12 pints. Despite their best efforts, Washington died on December 17, leading to speculation that excessive blood loss contributed to his demise.

slide-3
SLIDE 3

Classifying Studies V0D 2016 2016-Schield-Classifying-Studies.Slides.pdf 3

2016 Classifying Studies

V0D

13

Observational Studies:

1979: National Longitudinal Study of Youth

Followed youth (ages 14-22) for 26 years. Tracked employment status and other social

  • utcomes (prison, marriage, divorce, etc,)

http://www.bls.gov/nls/NLS-50th-Anniversary-Conference-Horrigan.pdf

Most controversial result was “The Bell Curve.” That book claimed that intelligence was real, hereditable and had high explanatory value.

2016 Classifying Studies

V0D

14

Observational Studies:

The Bell Curve

.

Probability of Poverty: IQ or SES

Uncontrolled

0% 5% 10% 15% 20% 25% 30% 35%

  • 2.0
  • 1.0

0.0 1.0 2.0

Z-scores (IQ and SES) P. 648

SES IQ

2016 Classifying Studies

V0D

15

Observational Studies:

The Bell Curve

.

Probability of Poverty versus IQ, SES

After controlling for the other

0% 5% 10% 15% 20% 25% 30%

  • 2.0
  • 1.0

0.0 1.0 2.0 Z-scores: IQ and Family's SocioEconomic Status (SES) P. 134 & 648

IQ, after controlling for Parent's SocioEconomic Status (SES) SES, after controlling for IQ

2016 Classifying Studies

V0D

16

Observational Studies: The Bell Curve

.

Chance of High School Dropout

2016 Classifying Studies

V0D

17

. .

2016 Classifying Studies

V0D

18

Quasi-Experiments: Examples Longitudinal: Auto fatalities before+after change in speed limits. City gun sales before+after sensationalized killing. Student activism before+after awareness campaign. Cross-sectional: College drinking levels at two similar colleges:

  • ne with alcohol orientation; other without.
slide-4
SLIDE 4

Classifying Studies V0D 2016 2016-Schield-Classifying-Studies.Slides.pdf 4

2016 Classifying Studies

V0D

19

Quasi-Experiment: Changing Concealed Carry Laws

In “More Guns; Less Crime”, John Lott used multivariate analysis to argue that passing concealed- carry laws for handguns reduced crime.

2016 Classifying Studies

V0D

20

Quasi-Experiment: Changing Concealed Carry Laws

. .

2016 Classifying Studies

V0D

21

Quasi-Experiment: Policing by Helicopter

. .

2016 Classifying Studies

V0D

22

Conclusion

Quasi-experiments are better than observational studies because the researcher or nature controls the assignment or the timing. Essential for studying those natural interventions

  • r disasters that are one-time only: floods,

typhoons, hurricanes, plagues, etc. Essential for those human interventions that are

  • ne-time only: surgery, training programs,

changing advertising, changing price/discounts/specials, etc.

slide-5
SLIDE 5

2016 Classifying Studies

V0D

1

MILO SCHIELD,

Augsburg College Director, W. M. Keck Statistical Literacy Project

US Rep, International Statistical Literacy Project Member, International Statistical Institute Webmaster: www.StatLit.org Fall, 2016

Slides at www.StatLit.org/pdf/2016-Schield-Studies-Slides.pdf

Classifying Studies: Features and Benefits

slide-6
SLIDE 6

2016 Classifying Studies

V0D

2

Influences on Statistics

Typically, statistics are used as evidence for causal connections. Statistics are numbers in context they can be influenced – if not determined – by their context. Their influences have been grouped into four categories: Confounding, Assembly, Randomness and Error (Bias). The following slide reviews confounding:

slide-7
SLIDE 7

2016 Classifying Studies

V0D

3

StatLit: Take CARE .

slide-8
SLIDE 8

2016 Classifying Studies

V0D

4

Classifying Studies

Experiment: Requires manipulation by researcher

  • Scientific: Homogeneous subjects; manipulation is

repeatable

  • Randomized controlled trials (RCT): Subjects are

heterogeneous; one-time manipulation Quasi-experiment: Manipulation by researcher or intervention (current or past) by nature. Observational study: Researcher is passive.

  • Longitudinal: Measurement before & after exposure
  • Cross-sectional: All measurements for same time.
slide-9
SLIDE 9

2016 Classifying Studies

V0D

5

Study Design Benefits: Resists Confounders

Experiment:

  • Scientific: Can resist all confounders.
  • Randomized controlled trials (RCT): Statistically

controls for all pre-existing confounders. Quasi-experiment: Researcher or nature initiates. Controls for time-dependent & constant confounders Observational study: Researcher is passive.

  • Longitudinal: Controls for constant confounders
  • Cross-sectional: Controls for time-dependent CF.
slide-10
SLIDE 10

2016 Classifying Studies

V0D

6

Reading Graphs

.

slide-11
SLIDE 11

2016 Classifying Studies

V0D

7

Famous Science Experiments Galileo: Falling velocity ~ time-squared Harvey: Heart drives blood circulation Newton: White light is a combination of colors Lavoisier: Discovery of oxygen Faraday: Showed light was electro-magnetic Joule: Showed that heat was really motion

Source: www.telegraph.co.uk/news/science/science- news/3341042/Top-ten-greatest-experiments.html

slide-12
SLIDE 12

2016 Classifying Studies

V0D

8

More Science Experiments: Repeatable .

slide-13
SLIDE 13

2016 Classifying Studies

V0D

9

More Science Experiments: Density of Water vs. Temp .

slide-14
SLIDE 14

2016 Classifying Studies

V0D

10

Randomized (Clinical) Trial: 1946: Salk Polio Vaccine Randomly assigned to second-graders.

slide-15
SLIDE 15

2016 Classifying Studies

V0D

11

Observational Studies: 1948: Framingham Study MI =myocardial infraction (aka heart attack). Systolic/diastolic: 130/90

slide-16
SLIDE 16

2016 Classifying Studies

V0D

12

Famous Quasi-Experiments: 1799: Bloodletting:

  • Dec. 13, 1799: George Washington awoke with a

bad sore throat and began to decline rapidly. He asked to be bled. Physicians drained an estimated 5 to 7 pints in less than 16 hours. Normal blood volume per adult is 8 to 12 pints. Despite their best efforts, Washington died on December 17, leading to speculation that excessive blood loss contributed to his demise.

slide-17
SLIDE 17

2016 Classifying Studies

V0D

13

Observational Studies:

1979: National Longitudinal Study of Youth

Followed youth (ages 14-22) for 26 years. Tracked employment status and other social

  • utcomes (prison, marriage, divorce, etc,)

http://www.bls.gov/nls/NLS-50th-Anniversary-Conference-Horrigan.pdf

Most controversial result was “The Bell Curve.” That book claimed that intelligence was real, hereditable and had high explanatory value.

slide-18
SLIDE 18

2016 Classifying Studies

V0D

14

Observational Studies:

The Bell Curve

.

Probability of Poverty: IQ or SES

Uncontrolled

0% 5% 10% 15% 20% 25% 30% 35%

  • 2.0
  • 1.0

0.0 1.0 2.0

Z-scores (IQ and SES) P. 648

SES IQ

slide-19
SLIDE 19

2016 Classifying Studies

V0D

15

Observational Studies:

The Bell Curve

.

Probability of Poverty versus IQ, SES

After controlling for the other

0% 5% 10% 15% 20% 25% 30%

  • 2.0
  • 1.0

0.0 1.0 2.0 Z-scores: IQ and Family's SocioEconomic Status (SES) P. 134 & 648

IQ, after controlling for Parent's SocioEconomic Status (SES) SES, after controlling for IQ

slide-20
SLIDE 20

2016 Classifying Studies

V0D

16

Observational Studies: The Bell Curve

.

Chance of High School Dropout

slide-21
SLIDE 21

2016 Classifying Studies

V0D

17

. .

slide-22
SLIDE 22

2016 Classifying Studies

V0D

18

Quasi-Experiments: Examples Longitudinal: Auto fatalities before+after change in speed limits. City gun sales before+after sensationalized killing. Student activism before+after awareness campaign. Cross-sectional: College drinking levels at two similar colleges:

  • ne with alcohol orientation; other without.
slide-23
SLIDE 23

2016 Classifying Studies

V0D

19

Quasi-Experiment: Changing Concealed Carry Laws

In “More Guns; Less Crime”, John Lott used multivariate analysis to argue that passing concealed- carry laws for handguns reduced crime.

slide-24
SLIDE 24

2016 Classifying Studies

V0D

20

Quasi-Experiment: Changing Concealed Carry Laws

. .

slide-25
SLIDE 25

2016 Classifying Studies

V0D

21

Quasi-Experiment: Policing by Helicopter

. .

slide-26
SLIDE 26

2016 Classifying Studies

V0D

22

Conclusion

Quasi-experiments are better than observational studies because the researcher or nature controls the assignment or the timing. Essential for studying those natural interventions

  • r disasters that are one-time only: floods,

typhoons, hurricanes, plagues, etc. Essential for those human interventions that are

  • ne-time only: surgery, training programs,

changing advertising, changing price/discounts/specials, etc.