
Excel2013 Model Trendline Linear 3Factor: 1Y1X-2Group XL2D 2/1/2017 V0K Excel2013-Model-Trendline-Linear-3Factor-Sides.pdf
Excel2013 Model Trendline Linear 3Factor XL2D V0K1
by Milo Schield Member: International Statistical Institute US Rep: International Statistical Literacy Project Director, W. M. Keck Statistical Literacy Project
Slides at: www.StatLit.org/pdf/ Excel2013-Model-Trendline-Linear-3Factor-slides.pdf
Model using Trendline Linear 3Factor in Excel 2013
Excel2013 Model Trendline Linear 3Factor XL2D V0K2
Goal: Summarize association before/after control for Gender
- 1. Generate Pivot table (slide 3)
- 2. Generate two XY charts (slides 4 and 10).
Show trend-line (linear model) and R2 as shown.
Subjects are college students. Data is at www.statlit.org/Excel/Pulse.xlsx Slide 4: See www.StatLit.org/pdf/Excel2013-Model- Trendline-Linear-Slides.pdf Slide 10: To put 2 series on same chart, see www.StatLit.org/ pdf/Excel2013-Model-Trendline-Linear-2Y1X-Slides.pdf
Excel2013 Model Trendline Linear 3Factor XL2D V0K3
Generate Summary Statistics Overall and by Gender: #1
Select all data. Insert Pivot Table. Use Male for column heading. 0=Female; 1 = Male. Put Height & Weight in body values. Change Sum to Average. If values spread horizontally, move ΣValues from Col to Row.
- 1. Average male-female weight difference: 34.5 pounds.
- 2. Average male-female height difference: 5.4 inches.
.
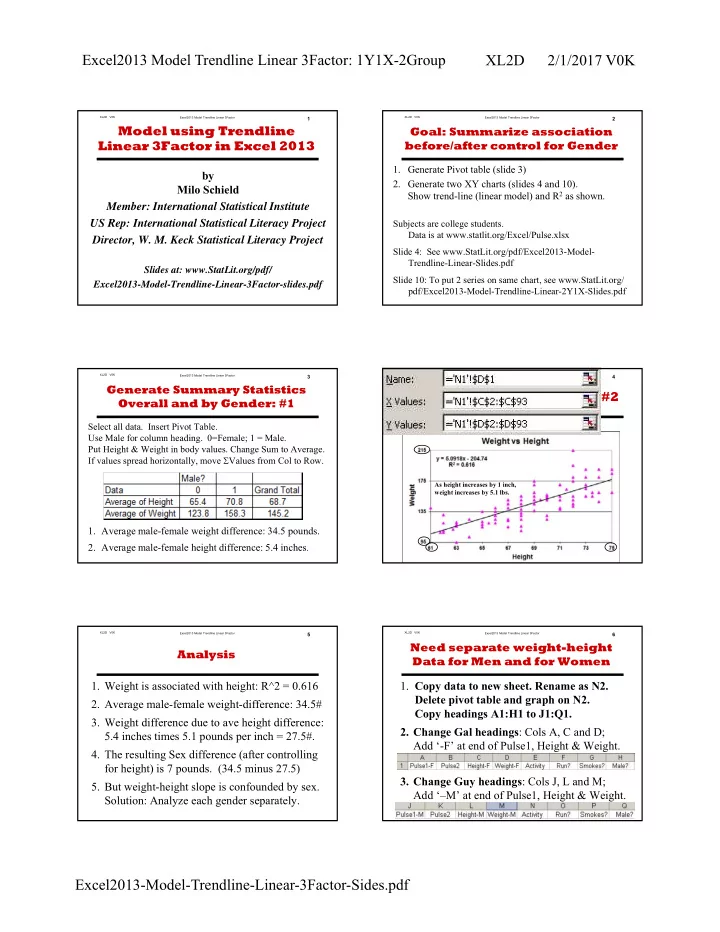
4
#2
As height increases by 1 inch, weight increases by 5.1 lbs.
Excel2013 Model Trendline Linear 3Factor XL2D V0K5
Analysis
- 1. Weight is associated with height: R^2 = 0.616
- 2. Average male-female weight-difference: 34.5#
- 3. Weight difference due to ave height difference:
5.4 inches times 5.1 pounds per inch = 27.5#.
- 4. The resulting Sex difference (after controlling
for height) is 7 pounds. (34.5 minus 27.5)
- 5. But weight-height slope is confounded by sex.
Solution: Analyze each gender separately.
Excel2013 Model Trendline Linear 3Factor XL2D V0K6
Need separate weight-height Data for Men and for Women
- 1. Copy data to new sheet. Rename as N2.
Delete pivot table and graph on N2. Copy headings A1:H1 to J1:Q1.
- 2. Change Gal headings: Cols A, C and D;
Add ‘-F’ at end of Pulse1, Height & Weight.
- 3. Change Guy headings: Cols J, L and M;
Add ‘–M’ at end of Pulse1, Height & Weight.