
Create Centered Stacked Bar Charts for Odd-Choice Ordinal Data using Excel 2013 V0A 12/11/2016 Excel2013-Bar-Chart-Ordinal-Centered-Odd-Slides.pdf 1
Excel2013: Create Centered Stacked 100% Bar Charts for Odd-Choice Ordinal Data V0A1
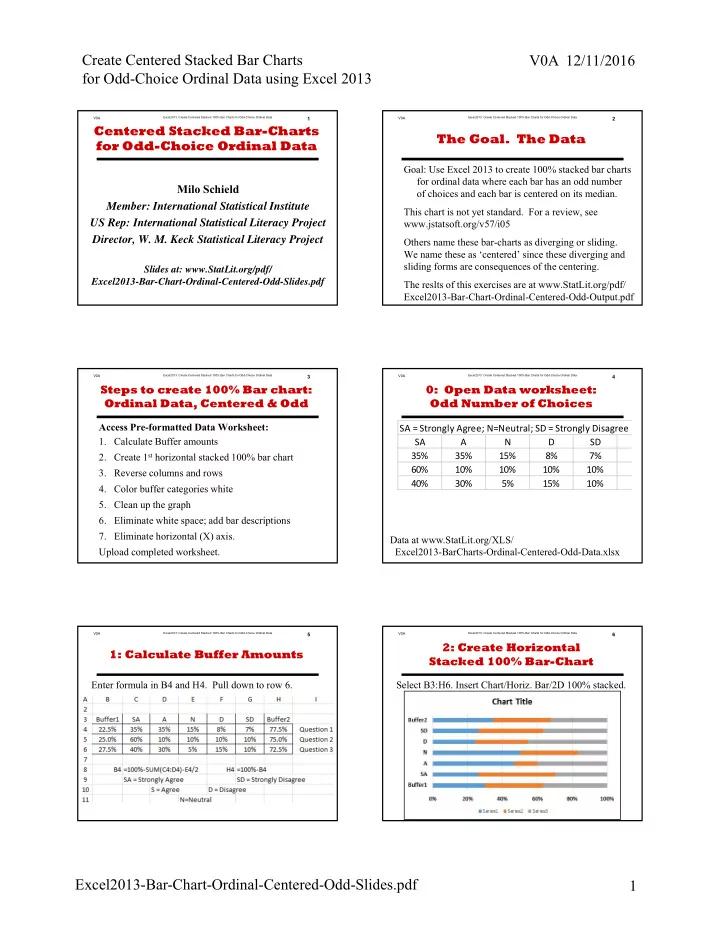
Milo Schield Member: International Statistical Institute US Rep: International Statistical Literacy Project Director, W. M. Keck Statistical Literacy Project
Slides at: www.StatLit.org/pdf/ Excel2013-Bar-Chart-Ordinal-Centered-Odd-Slides.pdf
Centered Stacked Bar-Charts for Odd-Choice Ordinal Data
Excel2013: Create Centered Stacked 100% Bar Charts for Odd-Choice Ordinal Data V0A2
The Goal. The Data
Goal: Use Excel 2013 to create 100% stacked bar charts for ordinal data where each bar has an odd number
- f choices and each bar is centered on its median.
This chart is not yet standard. For a review, see www.jstatsoft.org/v57/i05 Others name these bar-charts as diverging or sliding. We name these as ‘centered’ since these diverging and sliding forms are consequences of the centering. The reslts of this exercises are at www.StatLit.org/pdf/ Excel2013-Bar-Chart-Ordinal-Centered-Odd-Output.pdf
Excel2013: Create Centered Stacked 100% Bar Charts for Odd-Choice Ordinal Data V0A3
Steps to create 100% Bar chart: Ordinal Data, Centered & Odd
Access Pre-formatted Data Worksheet:
- 1. Calculate Buffer amounts
- 2. Create 1st horizontal stacked 100% bar chart
- 3. Reverse columns and rows
- 4. Color buffer categories white
- 5. Clean up the graph
- 6. Eliminate white space; add bar descriptions
- 7. Eliminate horizontal (X) axis.
Upload completed worksheet.
Excel2013: Create Centered Stacked 100% Bar Charts for Odd-Choice Ordinal Data V0A4
0: Open Data worksheet: Odd Number of Choices .
Data at www.StatLit.org/XLS/ Excel2013-BarCharts-Ordinal-Centered-Odd-Data.xlsx SA = Strongly Agree; N=Neutral; SD = Strongly Disagree SA A N D SD 35% 35% 15% 8% 7% 60% 10% 10% 10% 10% 40% 30% 5% 15% 10%
Excel2013: Create Centered Stacked 100% Bar Charts for Odd-Choice Ordinal Data V0A5
1: Calculate Buffer Amounts
Enter formula in B4 and H4. Pull down to row 6.
Excel2013: Create Centered Stacked 100% Bar Charts for Odd-Choice Ordinal Data V0ASelect B3:H6. Insert Chart/Horiz. Bar/2D 100% stacked.
6
2: Create Horizontal Stacked 100% Bar-Chart