
Down Syndrome by Birth Order and Moms Age 3/20/2017 V0 1 2017-Schield-Down-Syndrome-Slides.pdf
V0A
2017-Down-Syndrome1
by Milo Schield Member: International Statistical Institute US Rep: International Statistical Literacy Project Director, W. M. Keck Statistical Literacy Project
Slides and Data at: www.StatLit.org/ pdf/2017-Schield-Downs-Syndrome-Slides.pdf xls/2017-Schield-Downs-Syndrome-Data.xlsx
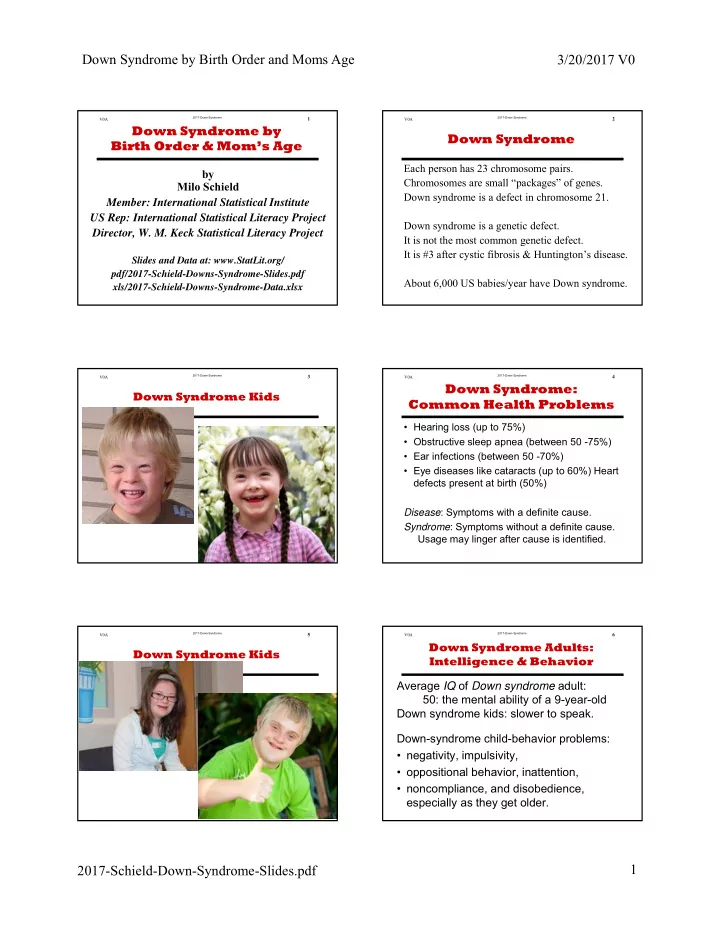
Down Syndrome by Birth Order & Mom’s Age
V0A
2017-Down-Syndrome2
Down Syndrome
Each person has 23 chromosome pairs. Chromosomes are small “packages” of genes. Down syndrome is a defect in chromosome 21. Down syndrome is a genetic defect. It is not the most common genetic defect. It is #3 after cystic fibrosis & Huntington’s disease. About 6,000 US babies/year have Down syndrome.
V0A
2017-Down-Syndrome3
Down Syndrome Kids
.
V0A
2017-Down-Syndrome4
Down Syndrome: Common Health Problems
- Hearing loss (up to 75%)
- Obstructive sleep apnea (between 50 -75%)
- Ear infections (between 50 -70%)
- Eye diseases like cataracts (up to 60%) Heart
defects present at birth (50%) Disease: Symptoms with a definite cause. Syndrome: Symptoms without a definite cause. Usage may linger after cause is identified.
V0A
2017-Down-Syndrome5
Down Syndrome Kids
.
V0A
2017-Down-Syndrome6
Down Syndrome Adults: Intelligence & Behavior Average IQ of Down syndrome adult: 50: the mental ability of a 9-year-old Down syndrome kids: slower to speak. Down-syndrome child-behavior problems:
- negativity, impulsivity,
- oppositional behavior, inattention,
- noncompliance, and disobedience,
especially as they get older.