
Math 5490 10/20/2014 Richard McGehee, University of Minnesota 1
Topics in Applied Mathematics: Introduction to the Mathematics of Climate
Mondays and Wednesdays 2:30 – 3:45
http://www.math.umn.edu/~mcgehee/teaching/Math5490-2014-2Fall/
Streaming video is available at
http://www.ima.umn.edu/videos/
Click on the link: "Live Streaming from 305 Lind Hall". Participation:
https://umconnect.umn.edu/mathclimate
Math 5490
October 20, 2014
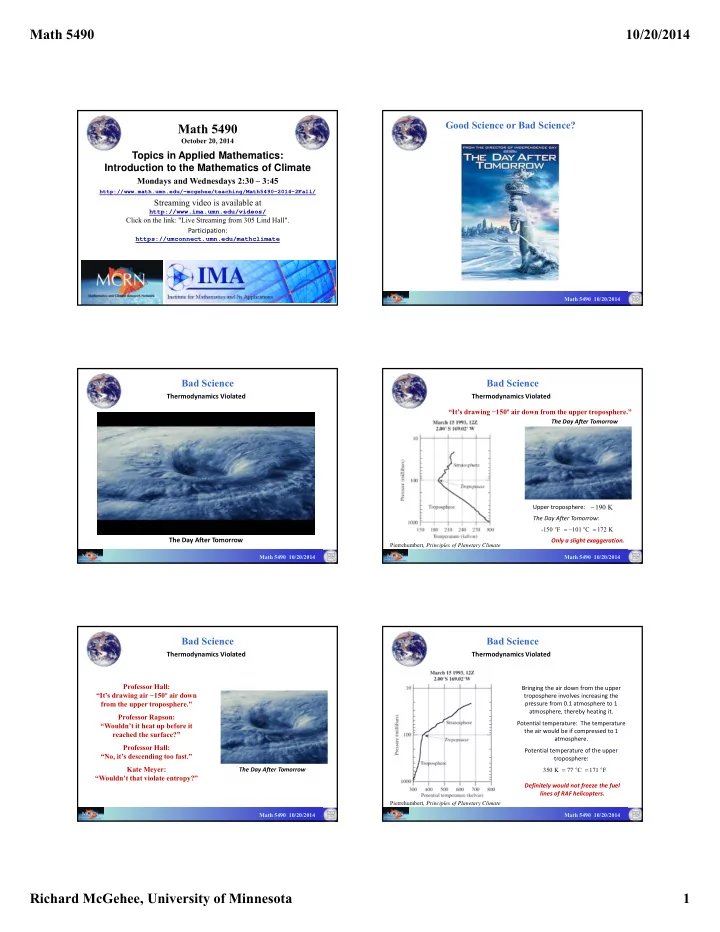
Good Science or Bad Science?
Math 5490 10/20/2014 Math 5490 10/20/2014
Bad Science
Thermodynamics Violated The Day After Tomorrow
Math 5490 10/20/2014
Bad Science
Thermodynamics Violated
The Day After Tomorrow
“It’s drawing −150º air down from the upper troposphere.”
Upper troposphere:
- 150 F
101 C 172 K
190 K The Day After Tomorrow: Only a slight exaggeration.
Pierrehumbert, Principles of Planetary Climate Math 5490 10/20/2014
Bad Science
Thermodynamics Violated
The Day After Tomorrow
Professor Hall: “It’s drawing air −150º air down from the upper troposphere.” Professor Rapson: “Wouldn’t it heat up before it reached the surface?” Professor Hall: “No, it’s descending too fast.” Kate Meyer: “Wouldn’t that violate entropy?”
Math 5490 10/20/2014
Bad Science
Thermodynamics Violated
Pierrehumbert, Principles of Planetary Climate
Bringing the air down from the upper troposphere involves increasing the pressure from 0.1 atmosphere to 1 atmosphere, thereby heating it. Potential temperature: The temperature the air would be if compressed to 1 atmosphere. Potential temperature of the upper troposphere:
- 350 K
77 C 171 F Definitely would not freeze the fuel lines of RAF helicopters.