
Math 5490 10/13/2014 Richard McGehee, University of Minnesota 1
Topics in Applied Mathematics: Introduction to the Mathematics of Climate
Mondays and Wednesdays 2:30 – 3:45
http://www.math.umn.edu/~mcgehee/teaching/Math5490-2014-2Fall/
Streaming video is available at
http://www.ima.umn.edu/videos/
Click on the link: "Live Streaming from 305 Lind Hall". Participation:
https://umconnect.umn.edu/mathclimate
Math 5490
October 13, 2014
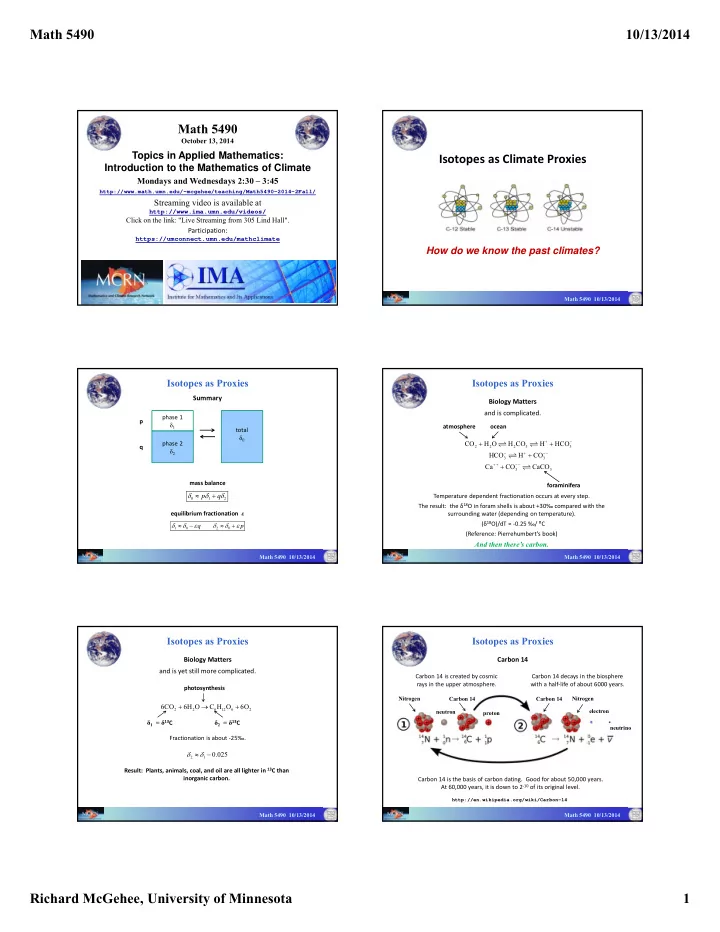
Isotopes as Climate Proxies
How do we know the past climates?
Math 5490 10/13/2014
Isotopes as Proxies
Summary
mass balance phase 2 δ2 phase 1 δ1 total δ0 p q
1 2
p q
1 2
q p equilibrium fractionation ε Math 5490 10/13/2014
Isotopes as Proxies
Biology Matters
2 2 2 3 3 3 3 3 3
CO H O H CO H HCO HCO H CO Ca CO CaCO
atmosphere
- cean
foraminifera Temperature dependent fractionation occurs at every step. The result: the δ18O in foram shells is about +30‰ compared with the surrounding water (depending on temperature). (δ18O)/dT ≈ ‐0.25 ‰/ ⁰C (Reference: Pierrehumbert’s book)
And then there’s carbon.
Math 5490 10/13/2014
and is complicated.
Isotopes as Proxies
Biology Matters and is yet still more complicated.
Fractionation is about ‐25‰.
2 2 6 12 6 2
6CO 6H O C H O 6O photosynthesis δ1 = δ13C δ2 = δ13C
2 1
0.025 Result: Plants, animals, coal, and oil are all lighter in 13C than inorganic carbon.
Math 5490 10/13/2014
Isotopes as Proxies
Math 5490 10/13/2014
Carbon 14
Nitrogen neutron Carbon 14 proton Carbon 14 Nitrogen electron neutrino
Carbon 14 is created by cosmic rays in the upper atmosphere. Carbon 14 decays in the biosphere with a half‐life of about 6000 years. Carbon 14 is the basis of carbon dating. Good for about 50,000 years. At 60,000 years, it is down to 2‐10 of its original level.
http://en.wikipedia.org/wiki/Carbon-14