
Teaching Statistical Literacy: Chapter 2 16 May 2019 V0 2019-Schield-USCOTS-Slides2.pdf 1
2019 USCOTS WorkshopV1 1
Statistical Literacy Details Chapter 2 by Milo Schield USCOTS Workshop May 16, 2019
www.StatLit.org/pdf/2019-Schield-USCOTS-Slides2.pdf
Statistics Literacy For Decision Makers
2019 USCOTS WorkshopV1
Associations: Comparison and Co-Variation
- Comparisons: Ordered and Arithmetic
- Comparisons: Kinds of Arithmetic
Take CARE: Solutions
- Confounder control: effect size, study design
- Assembly:
- Randomness: Test for statistical significance
- Error/Bias: Single & Double blind.
2
Take CARE: Details Chapter 2 Outline
2019 USCOTS WorkshopV1 ./ 3
Stat Literacy studies Stats as Evidence in Arguments
2019 USCOTS WorkshopV1
Two-group comparisons:
- Men are taller than women
- Women live longer than men
Two-factor Covariation
- As height increases, weight increases
- The more height, the more weight
4
Associations: Two Kinds
2019 USCOTS WorkshopV1
Ordinal (Order): Women live longer than men Arithmetic:
- Men shave six days more/week than women
6% is one percentage point more than the 5%
- Men shave seven times as much as women.
- Men save 600% more often than women.
6% is 20% more than 5%. Men shave six times more often than women. Women shave 7 times less often than men
5
Comparisons: Two Kinds
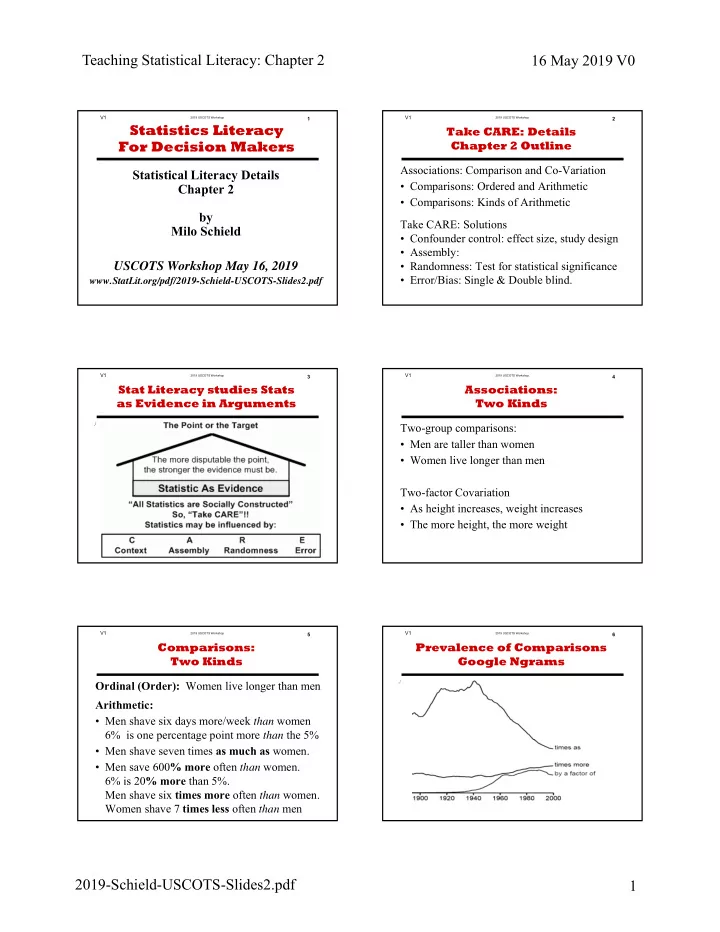
2019 USCOTS WorkshopV1 ./ 6
Prevalence of Comparisons Google Ngrams