
Teaching Statistical Literacy: Chapter 3 16 May 2019 V1 2019-Schield-USCOTS-Slides3.pdf 1
2019 USCOTS WorkshopCh3: V1 1
Chapter 3: Measurements by Milo Schield Half-Day Workshop USCOTS May 16, 2019
www.StatLit.org/pdf/2019-Schield-USCOTS-Slides3.pdf
Statistics Literacy For Decision Makers
2019 USCOTS WorkshopCh3: V1
Distributions Measures of center Two-group comparisons of Means & Medians Two-variable co-variation Spread Slope and simple regression
2
Measurements: Chapter 3 Outline
2019 USCOTS WorkshopCh3: V1 ./ 3
Stat Literacy: Study Statistics as Evidence in Arguments
2019 USCOTS WorkshopCh3: V1
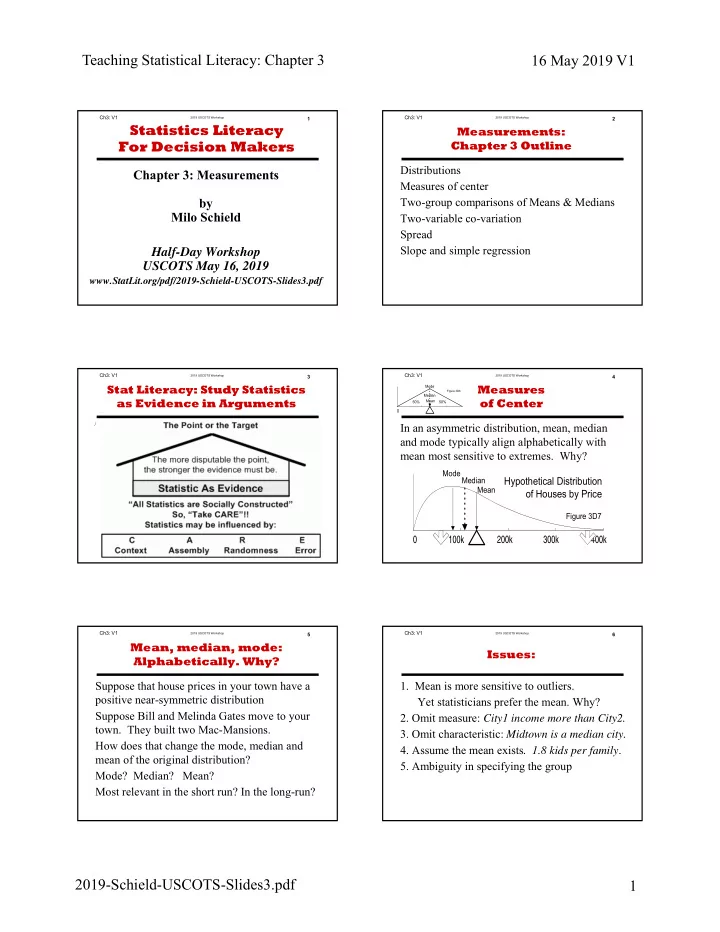
In an asymmetric distribution, mean, median and mode typically align alphabetically with mean most sensitive to extremes. Why?
4
Measures
- f Center
100k 200k 300k 400k
Figure 3D7
Hypothetical Distribution
- f Houses by Price
Mean Mode Median
2019 USCOTS WorkshopCh3: V1
Suppose that house prices in your town have a positive near-symmetric distribution Suppose Bill and Melinda Gates move to your
- town. They built two Mac-Mansions.
How does that change the mode, median and mean of the original distribution? Mode? Median? Mean? Most relevant in the short run? In the long-run?
5
Mean, median, mode:
- Alphabetically. Why?
Ch3: V1
- 1. Mean is more sensitive to outliers.
Yet statisticians prefer the mean. Why?
- 2. Omit measure: City1 income more than City2.
- 3. Omit characteristic: Midtown is a median city.
- 4. Assume the mean exists. 1.8 kids per family.
- 5. Ambiguity in specifying the group
6
Issues: