
Teaching Confounder-Based Statistical Literacy 19 June, 2019 2019-Schield-UNM-slides.pdf 1
2019 Univ. New Mexico 0D1
Milo Schield, US
Fellow: American Statistical Assoc. US Rep: International Statistical Literacy Project
June 19, 2019
- Dept. Math & Statistics
University of New Mexico
www.StatLit.org/pdf/2019-Schield-UNM-Slides.pdf
Teaching Confounder-Based Statistical Literacy
2019 Univ. New Mexico 0D2
Confounding is used to show that “association is not causation”. We then spend an entire semester on randomness (never mentioning confounding again).
Confounding: Common Misuse
This is “Bait and Switch”. “Bait and switch” is unethical! “Bait and switch” is professional negligence! This is arguably why most students see less value in ‘statistics’ after taking the intro research-methods course – than they did before taking the course.
2019 Univ. New Mexico 0D3
Do some people have special powers? Let’s find out. Who gets longest run?
- Q1. Could the winner have special powers?
- Q2. What’s another explanation?
My First Day #1: Coincidence (Chance)
Luck, coincidence, chance or “skill”?
- Q3. How can we find out right now?
Do it again (Repeat)
2019 Univ. New Mexico 0D4
Studies show: “People that read home and fashion magazines are much more likely to get pregnant than people that read car and sport magazines.”
First Day #2: Confounding
Suppose the best hospital had the highest death rate.
- Q3. Is this strong evidence it’s a bad hospital?
Stratify! Q2 How can we see this in the data? Stratify! Q1 What’s an alternate explanation? Gender
- Q4. What’s an alternate explanation?
Patient health
- Q5. How can we see this in the data?
5
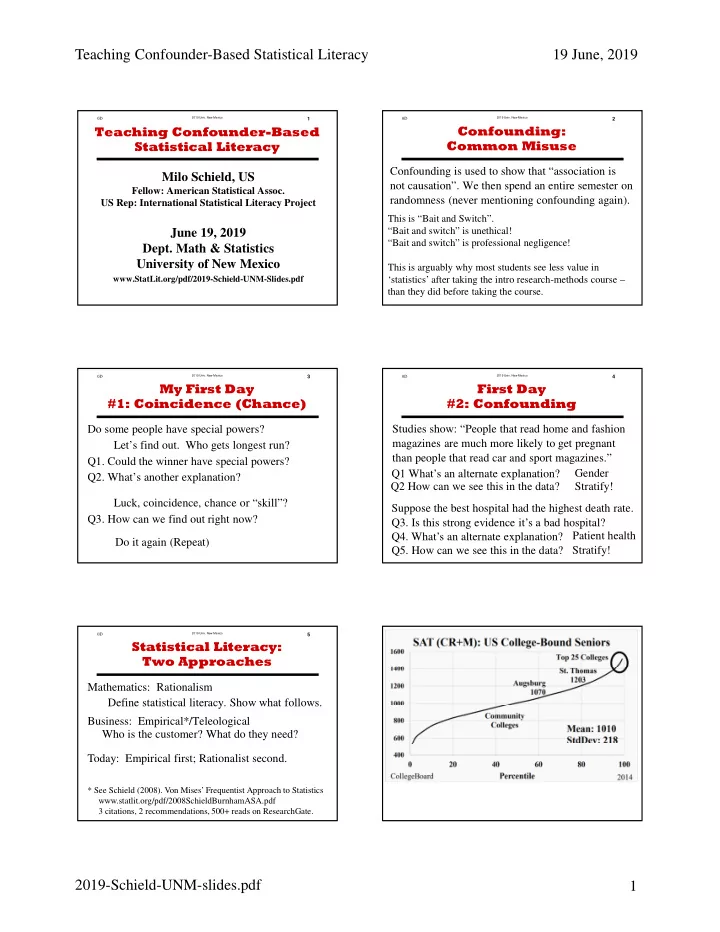
Mathematics: Rationalism Define statistical literacy. Show what follows. Business: Empirical*/Teleological Who is the customer? What do they need?
Statistical Literacy: Two Approaches
Today: Empirical first; Rationalist second.
* See Schield (2008). Von Mises’ Frequentist Approach to Statistics www.statlit.org/pdf/2008SchieldBurnhamASA.pdf 3 citations, 2 recommendations, 500+ reads on ResearchGate.
2019 Univ. New Mexico 0D6
.
Our Students