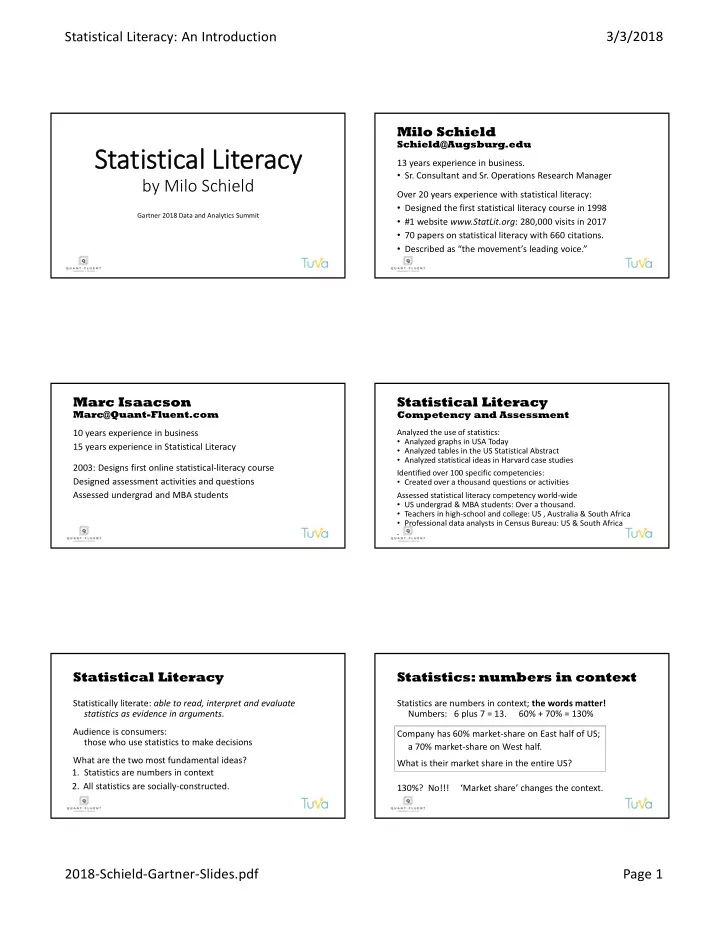

Statistical Literacy: An Introduction 3/3/2018 Milo Schield Schield@Augsburg.edu Statistical Literacy 13 years experience in business. • Sr. Consultant and Sr. Operations Research Manager by Milo Schield Over 20 years experience with statistical literacy: • Designed the first statistical literacy course in 1998 Gartner 2018 Data and Analytics Summit • #1 website www.StatLit.org : 280,000 visits in 2017 • 70 papers on statistical literacy with 660 citations. • Described as “the movement’s leading voice.” Marc Isaacson Statistical Literacy Marc@Quant-Fluent.com Competency and Assessment 10 years experience in business Analyzed the use of statistics: • Analyzed graphs in USA Today 15 years experience in Statistical Literacy • Analyzed tables in the US Statistical Abstract • Analyzed statistical ideas in Harvard case studies 2003: Designs first online statistical‐literacy course Identified over 100 specific competencies: Designed assessment activities and questions • Created over a thousand questions or activities Assessed undergrad and MBA students Assessed statistical literacy competency world‐wide • US undergrad & MBA students: Over a thousand. • Teachers in high‐school and college: US , Australia & South Africa • Professional data analysts in Census Bureau: US & South Africa . Statistical Literacy Statistics: numbers in context Statistically literate: able to read, interpret and evaluate Statistics are numbers in context; the words matter! statistics as evidence in arguments. Numbers: 6 plus 7 = 13. 60% + 70% = 130% Audience is consumers: Company has 60% market‐share on East half of US; those who use statistics to make decisions a 70% market‐share on West half. What are the two most fundamental ideas? What is their market share in the entire US? 1. Statistics are numbers in context 2. All statistics are socially‐constructed. 130%? No!!! ‘Market share’ changes the context. 2018‐Schield‐Gartner‐Slides.pdf Page 1
Statistical Literacy: An Introduction 3/3/2018 Gatlinburg: $95/night Statistics: socially constructed Statistics are like diamonds! . . . 8 Planned Parenthood Look closely at these numbers! . . Ask Questions! Victims: MV School-Shooting . . 4.4 / year 2018‐Schield‐Gartner‐Slides.pdf Page 2
Statistical Literacy: An Introduction 3/3/2018 Statistical Literacy: An Art! School-shootings; Mass killings Evaluate Strength of Evidence Classify all the influences on a statistic into four groups: . C: Context/confounding : Study design; effect size; control for; ordinary English for rates, %. A: Assembly : definitions, groups and measures R: Randomness : margin of error, statistical significance; Coincidence; Confounder effect on statistical significance E: Error or Bias (subject, measurement and sampling) . 13 Assess Statistical Literacy Schedule a meeting! Two Types of Assessment Marc Isaacson, Quant‐Fluent Self‐report (attitudes) vs Competency (skills) Marc@Quant‐Fluent.com Competency Based Harshill Parikh, TUVA Quant‐Fluent and TUVA hsparikh@tuvalabs.com https://gartnerdatasummit‐demo.tuvalabs.com/ https://gartnerdatasummit‐demo.tuvalabs.com/ www.Quant‐Fluent.com www.Quant‐Fluent.com 15 16 2018‐Schield‐Gartner‐Slides.pdf Page 3
St Statistical L Liter eracy by Milo Schield Gartner 2018 Data and Analytics Summit
Milo Schield Schield@Augsburg.edu 13 years experience in business. • Sr. Consultant and Sr. Operations Research Manager Over 20 years experience with statistical literacy: • Designed the first statistical literacy course in 1998 • #1 website www.StatLit.org : 280,000 visits in 2017 • 70 papers on statistical literacy with 660 citations. • Described as “the movement’s leading voice.”
Marc Isaacson Marc@Quant-Fluent.com 10 years experience in business 15 years experience in Statistical Literacy 2003: Designs first online statistical-literacy course Designed assessment activities and questions Assessed undergrad and MBA students
Statistical Literacy Competency and Assessment Analyzed the use of statistics: • Analyzed graphs in USA Today • Analyzed tables in the US Statistical Abstract • Analyzed statistical ideas in Harvard case studies Identified over 100 specific competencies: • Created over a thousand questions or activities Assessed statistical literacy competency world-wide • US undergrad & MBA students: Over a thousand. • Teachers in high-school and college: US , Australia & South Africa • Professional data analysts in Census Bureau: US & South Africa .
Statistical Literacy Statistically literate: able to read, interpret and evaluate statistics as evidence in arguments. Audience is consumers: those who use statistics to make decisions What are the two most fundamental ideas? 1. Statistics are numbers in context 2. All statistics are socially-constructed.
Statistics: numbers in context Statistics are numbers in context; the words matter! Numbers: 6 plus 7 = 13. 60% + 70% = 130% Company has 60% market-share on East half of US; a 70% market-share on West half. What is their market share in the entire US? 130%? No!!! ‘Market share’ changes the context.
Statistics: socially constructed Statistics are like diamonds! .
Gatlinburg: $95/night . . 8
Planned Parenthood .
Look closely at these numbers! .
Ask Questions! .
Victims: MV School-Shooting . 4.4 / year
School-shootings; Mass killings . 13
Statistical Literacy: An Art! Evaluate Strength of Evidence Classify all the influences on a statistic into four groups: C: Context/confounding : Study design; effect size; control for; ordinary English for rates, %. A: Assembly : definitions, groups and measures R: Randomness : margin of error, statistical significance; Coincidence; Confounder effect on statistical significance E: Error or Bias (subject, measurement and sampling) .
Assess Statistical Literacy Two Types of Assessment Self-report (attitudes) vs Competency (skills) Competency Based Quant-Fluent and TUVA https://gartnerdatasummit-demo.tuvalabs.com/ www.Quant-Fluent.com 15
Schedule a meeting! Marc Isaacson, Quant-Fluent Marc@Quant-Fluent.com Harshill Parikh, TUVA hsparikh@tuvalabs.com https://gartnerdatasummit-demo.tuvalabs.com/ www.Quant-Fluent.com 16
Recommend
More recommend