
Statistical Literacy: An Introduction 20-21 Sept 2019 2019-Schield-NNN-Palomar-Slides.pdf 1
Schield: 2019 NNN Palomar WorkshopV1 1
by Milo Schield, NNN VP NNN Workshop Palomar CC Sept 20-21, 2019
www.StatLit.org/pdf/ 2019-Schield-NNN-Palomar-Slides.pdf
Statistical Literacy: An Introduction
Schield: 2019 NNN Palomar WorkshopV1
Statistics:
- Traditional): numerical properties of samples
- (Stat Lit): numbers in context (in reality)
Signs of context: time, place and units
- 7.7 billion is a number.
- 7.7 billion people on earth today* is a statistic.
* Sept, 2019.
2
What are Statistics?
Schield: 2019 NNN Palomar WorkshopV1
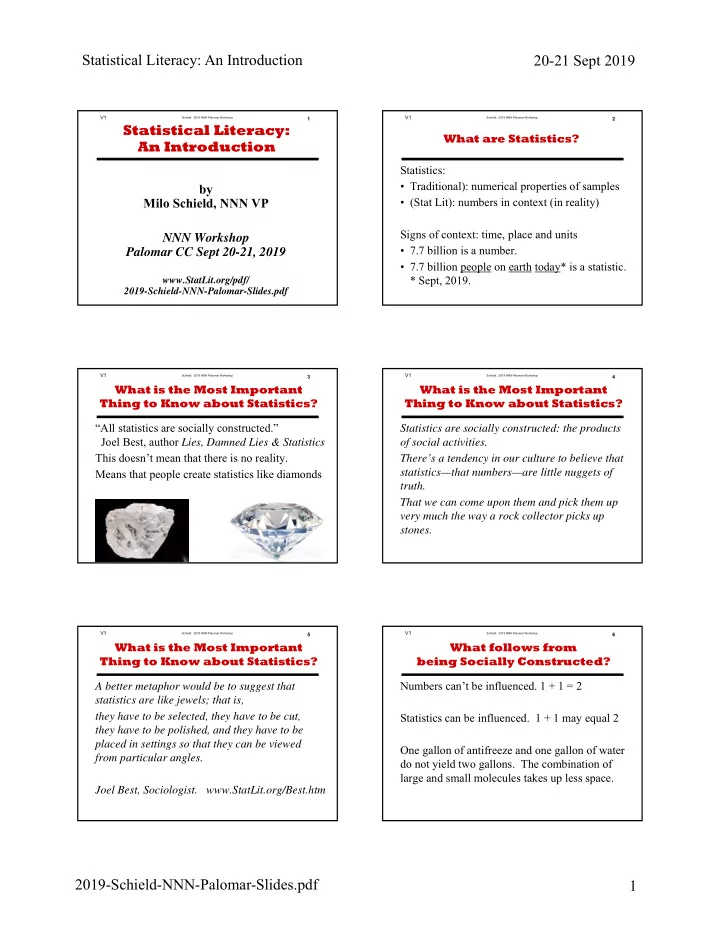
“All statistics are socially constructed.” Joel Best, author Lies, Damned Lies & Statistics This doesn’t mean that there is no reality. Means that people create statistics like diamonds
3
What is the Most Important Thing to Know about Statistics?
Schield: 2019 NNN Palomar WorkshopV1
Statistics are socially constructed: the products
- f social activities.
There’s a tendency in our culture to believe that statistics—that numbers—are little nuggets of truth. That we can come upon them and pick them up very much the way a rock collector picks up stones.
4
What is the Most Important Thing to Know about Statistics?
Schield: 2019 NNN Palomar WorkshopV1
A better metaphor would be to suggest that statistics are like jewels; that is, they have to be selected, they have to be cut, they have to be polished, and they have to be placed in settings so that they can be viewed from particular angles. Joel Best, Sociologist. www.StatLit.org/Best.htm
5
What is the Most Important Thing to Know about Statistics?
Schield: 2019 NNN Palomar WorkshopV1
Numbers can’t be influenced. 1 + 1 = 2 Statistics can be influenced. 1 + 1 may equal 2 One gallon of antifreeze and one gallon of water do not yield two gallons. The combination of large and small molecules takes up less space.
6
What follows from being Socially Constructed?