statistical literacy march 1998
play

Statistical Literacy March 1998 Statistics STATISTICAL Statistics - PDF document

Statistical Literacy March 1998 Statistics STATISTICAL Statistics 3/99 3/99 Association Association Definitions 1 2 LITERACY Causation Causation Statistics studies variation in data. Wollongong University What are the natures and


  1. Statistical Literacy March 1998 Statistics STATISTICAL Statistics 3/99 3/99 Association Association Definitions 1 2 LITERACY Causation Causation Statistics studies variation in data. Wollongong University What are the natures and causes of variation? March 1999 Statistical inference studies the results of chance: sampling distributions, confidence Milo Schield intervals and hypothesis tests. Augsburg College Minneapolis Minnesota USA Statistical literacy studies the use of statistics as www.augsburg.edu/ppages/schield evidence in arguments. schield@augsburg.edu Statistics Statistics Natures and Causes Analyzing the influence of 3/99 3/99 Association Association 3 4 of Variation chance Causation Causation This variation is expected if due to chance. Probability: The higher the probability, the more reason one has to believe that This variation is unlikely if due to chance. the outcome is true (or will occur). Confidence Intervals. The higher the level of This variation is unlikely due to chance. confidence, the more reason one has to believe that the fixed interval contains the fixed parameter. This variation is unlikely to be due to chance. This variation is likely to be due to Hypothesis tests: The smaller the p-value, the more reason one has to believe that the alternate is true. a determinate cause. Statistics Statistics Analyzing the Distinguishing Association 3/99 3/99 Association Association 5 6 Influence of Bias From Causation Causation Causation The death rate in Washington DC is twice as high In regressing the value of houses on the number as that in Alaska. of baths, we find that we can expect an 25,000 increase in the price of the house Suppose a randomly selected group of Alaskans are moved from Alaska to Washington DC. • in houses having an additional bathroom Are they twice as likely to die? • for each additional bathroom • when adding an additional bathroom. Yes because …. No because …. www.StatLit.org/pdf/1998-Schield-Wollongong-Slides.pdf 1

  2. Statistical Literacy March 1998 Statistics Statistics Predicting Reversal: From Statistical Association 3/99 3/99 Association Association 7 8 % of Murders - Death Penalty To Policy Prescription Causation Causation The death penalty was given to Statistics are used to support policy prescriptions. • 11.9% of white murderers and Data from an observational study is transformed into • 10.5% of black murders. supporting a public policy as follows: 1. Association or Correlation The death penalty was given in 2. Causation [this is often implicit] • 14.0% of the cases with a white victim and 3. Prediction or Prescription • 5.4% of the cases with a black victim. Examples: Accident rates and car phones Death rates and radon levels We could have a Simpson's Paradox reversal. Statistics Statistics Statistical Literacy and General Literacy: 3/99 3/99 Association Association 9 10 General Thinking Basic Tools Causation Causation Statistical Literacy must be related to general literacy. All students should be able to • recognize a claim: a prediction, an explanation, an evaluation, a prescription, a generalization, etc.. Statistical Literacy should focus on general tools and techniques that students will use again in a variety of • evaluate the disputability of a claim. courses. • identify an argument used to support a conclusion. • distinguish premises and conclusion in an argument. • analyze the support given for the truth of a claim. • evaluate the strength of an argument. Statistics Statistics Statistical Literacy: 3/99 3/99 Conclusion Association Association 11 12 Basic Causation Causation Students should be able to Statistical Literacy focuses on the use of numerical statistics to identify causes and to • read and express statistics (counts, percents, rates and statistical measures) in both tables and graphs. recommending actions and decisions. • distinguish association from causation. Students should be able to read and evaluate • recognize that association is not causation. broad arguments involving statistics: • distinguish chance from a determinate cause. • The Bell Curve by Herrnstein and Murray • distinguish common causes from a direct cause(s). • Population by Julian Simon • distinguish experiments from observational studies. • Books by Thomas Sowell www.StatLit.org/pdf/1998-Schield-Wollongong-Slides.pdf 2

  3. Statistics STATISTICAL 3/99 Association 1 LITERACY Causation Wollongong University March 1999 Milo Schield Augsburg College Minneapolis Minnesota USA www.augsburg.edu/ppages/schield schield@augsburg.edu
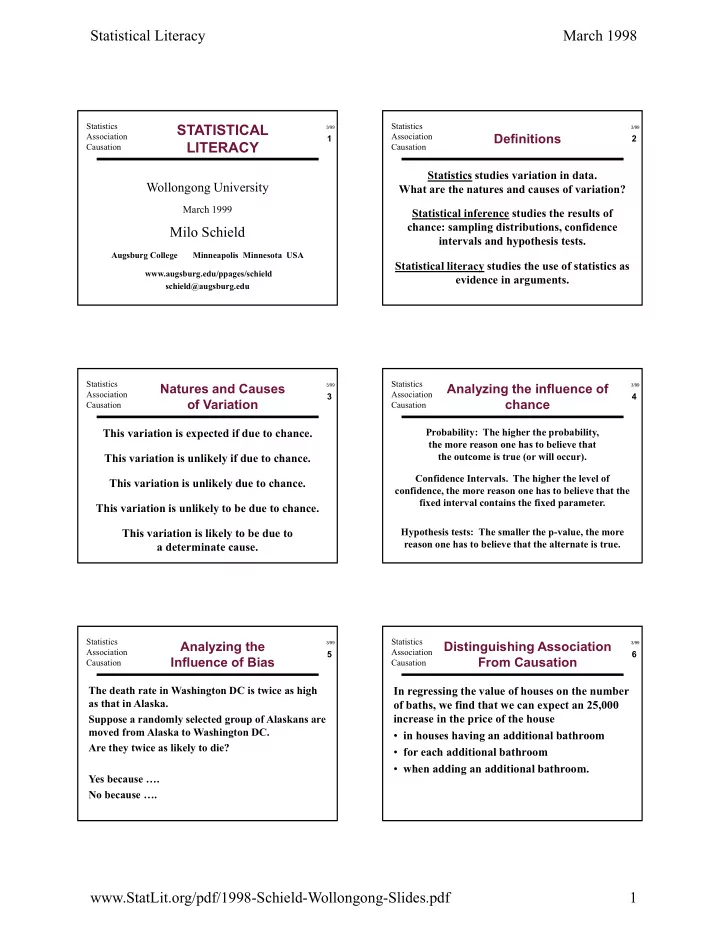
  4. Statistics 3/99 Association Definitions 2 Causation Statistics studies variation in data. What are the natures and causes of variation? Statistical inference studies the results of chance: sampling distributions, confidence intervals and hypothesis tests. Statistical literacy studies the use of statistics as evidence in arguments.

  5. Statistics 3/99 Natures and Causes Association 3 of Variation Causation This variation is expected if due to chance. This variation is unlikely if due to chance. This variation is unlikely due to chance. This variation is unlikely to be due to chance. This variation is likely to be due to a determinate cause.

  6. Statistics 3/99 Analyzing the influence of Association 4 chance Causation Probability: The higher the probability, the more reason one has to believe that the outcome is true (or will occur). Confidence Intervals. The higher the level of confidence, the more reason one has to believe that the fixed interval contains the fixed parameter. Hypothesis tests: The smaller the p-value, the more reason one has to believe that the alternate is true.

  7. Statistics 3/99 Analyzing the Association 5 Influence of Bias Causation The death rate in Washington DC is twice as high as that in Alaska. Suppose a randomly selected group of Alaskans are moved from Alaska to Washington DC. Are they twice as likely to die? Yes because …. No because ….

  8. Statistics 3/99 Distinguishing Association Association 6 From Causation Causation In regressing the value of houses on the number of baths, we find that we can expect an 25,000 increase in the price of the house • in houses having an additional bathroom • for each additional bathroom • when adding an additional bathroom.

  9. Statistics 3/99 Predicting Reversal: Association 7 % of Murders - Death Penalty Causation The death penalty was given to • 11.9% of white murderers and • 10.5% of black murders. The death penalty was given in • 14.0% of the cases with a white victim and • 5.4% of the cases with a black victim. We could have a Simpson's Paradox reversal.

  10. Statistics 3/99 From Statistical Association Association 8 To Policy Prescription Causation Statistics are used to support policy prescriptions. Data from an observational study is transformed into supporting a public policy as follows: 1. Association or Correlation 2. Causation [this is often implicit] 3. Prediction or Prescription Examples: Accident rates and car phones Death rates and radon levels

  11. Statistics 3/99 Statistical Literacy and Association 9 General Thinking Causation Statistical Literacy must be related to general literacy. Statistical Literacy should focus on general tools and techniques that students will use again in a variety of courses.

  12. Statistics 3/99 General Literacy: Association 10 Basic Tools Causation All students should be able to • recognize a claim: a prediction, an explanation, an evaluation, a prescription, a generalization, etc.. • evaluate the disputability of a claim. • identify an argument used to support a conclusion. • distinguish premises and conclusion in an argument. • analyze the support given for the truth of a claim. • evaluate the strength of an argument.

  13. Statistics 3/99 Statistical Literacy: Association 11 Basic Causation Students should be able to • read and express statistics (counts, percents, rates and statistical measures) in both tables and graphs. • distinguish association from causation. • recognize that association is not causation. distinguish chance from a determinate cause. • • distinguish common causes from a direct cause(s). • distinguish experiments from observational studies.

  14. Statistics 3/99 Association Conclusion 12 Causation Statistical Literacy focuses on the use of numerical statistics to identify causes and to recommending actions and decisions. Students should be able to read and evaluate broad arguments involving statistics: • The Bell Curve by Herrnstein and Murray • Population by Julian Simon • Books by Thomas Sowell

Download Presentation
Download Policy: The content available on the website is offered to you 'AS IS' for your personal information and use only. It cannot be commercialized, licensed, or distributed on other websites without prior consent from the author. To download a presentation, simply click this link. If you encounter any difficulties during the download process, it's possible that the publisher has removed the file from their server.

Recommend


More recommend