
SLIDE 1
CSIRO OCEANS & ATMOSPHERE
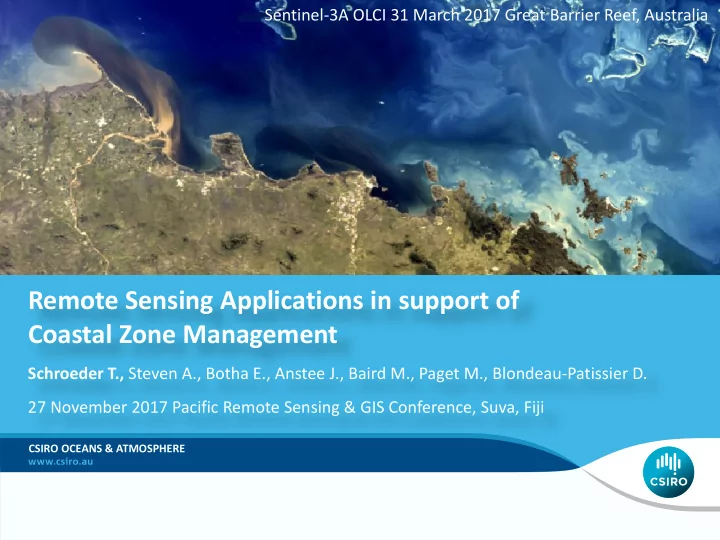
Remote Sensing Applications in support of Coastal Zone Management
Schroeder T., Steven A., Botha E., Anstee J., Baird M., Paget M., Blondeau-Patissier D. 27 November 2017 Pacific Remote Sensing & GIS Conference, Suva, Fiji Sentinel-3A OLCI 31 March 2017 Great Barrier Reef, Australia