Lesson 3: Turning Data Into Information by Creating Wetland Maps and - - PDF document

lesson 3 turning data into information by creating
SMART_READER_LITE
LIVE PREVIEW

Lesson 3: Turning Data Into Information by Creating Wetland Maps and - - PDF document

Lesson 3: Turning Data Into Information by Creating Wetland Maps and Analyzing Water Quality Data Objectives: Students will: Learn to create maps using Google Earth as a geographical information system (GIS). Learn to analyze field data and


slide-1
SLIDE 1

for NM Department of Game and Fish Share with Wildlife Lesson 3 – Turning Data into Information page 1

Lesson 3: Turning Data Into Information by Creating Wetland Maps and Analyzing Water Quality Data

Objectives: Students will:  Learn to create maps using Google Earth as a geographical information system (GIS).  Learn to analyze field data and techniques to graph and report scientific data. Recommended duration: 2 classroom sessions Proposed method: Students will learn methods to analyze scientific data including graphing and reporting in poster format and PowerPoint. GPS data will be downloaded and imported to Google earth or similar mapping software to develop spatial maps of wetlands monitored. Materials:

  • 1. GPS data that has been downloaded to a computer (need GPS and cable or a data file

from someone who has downloaded the data already).

  • 2. Field data forms and Data to Information worksheet for water chemistry
  • 3. Computer with Excel and Power point capabilities and internet access to load Google
  • Earth. An alternative is to use Google Docs to create graphs and analyze water quality

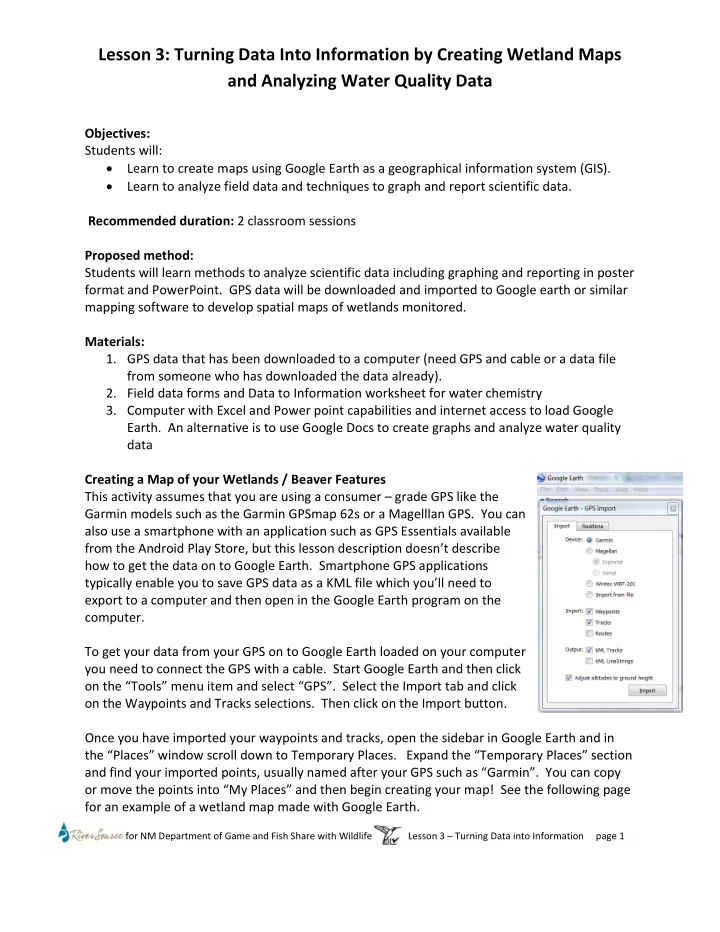
data Creating a Map of your Wetlands / Beaver Features This activity assumes that you are using a consumer – grade GPS like the Garmin models such as the Garmin GPSmap 62s or a Magelllan GPS. You can also use a smartphone with an application such as GPS Essentials available from the Android Play Store, but this lesson description doesn’t describe how to get the data on to Google Earth. Smartphone GPS applications typically enable you to save GPS data as a KML file which you’ll need to export to a computer and then open in the Google Earth program on the computer. To get your data from your GPS on to Google Earth loaded on your computer you need to connect the GPS with a cable. Start Google Earth and then click

  • n the “Tools” menu item and select “GPS”. Select the Import tab and click
  • n the Waypoints and Tracks selections. Then click on the Import button.

Once you have imported your waypoints and tracks, open the sidebar in Google Earth and in the “Places” window scroll down to Temporary Places. Expand the “Temporary Places” section and find your imported points, usually named after your GPS such as “Garmin”. You can copy

  • r move the points into “My Places” and then begin creating your map! See the following page

for an example of a wetland map made with Google Earth.

slide-2
SLIDE 2

for NM Department of Game and Fish Share with Wildlife Lesson 3 – Turning Data into Information page 2

Data from fall 2013, collected by Mora High School students

slide-3
SLIDE 3

for NM Department of Game and Fish Share with Wildlife Lesson 3 – Turning Data into Information page 3

Activity for Students to See Patterns in Data & Turn Data into Information

  • 1. Why turn your data to information? Analyzing river ecology data

completes the learning process by comparing data results with your predictions of what you expected, looking at data gaps and other data sources, and reporting your findings to the community. In New Mexico Watershed Watch we start by comparing results to aquatic health and human standards. Your task is to weave the field experiences & analysis into a story that compels people to become engaged in the monitoring process and find ways to adopt healthy watershed management practices.

  • 2. How

 Introduce students to river ecology concepts, river measurement methods and get students to make predictions of what they expect to see for the data.  Have students focus on two parameters.  Teacher needs to arrive at classroom with copies of this worksheet, graph paper and colored pencils, and a tabular form of the all the data (sometimes highlighting the data students will analyze for their convenience).

  • 3. When to do this

At the end of the first semester or at a minimum during April for an end-

  • f-the-year presentation. Your curriculum approach will dictate when

in the class cycle you do this but it’s always going to take place prior to making your community presentation. Consider giving yourself 2 class periods if you only have 1 hour-long classes. Begin organizing and graphing data to start comparing data at same site over several months as soon as time allows.

slide-4
SLIDE 4

for NM Department of Game and Fish Share with Wildlife Lesson 3 – Turning Data into Information page 4

The overall objective is to play with the data and see what story it tells,

  • r doesn’t, and make recommendations. The activities to achieve this

include:

  • a. Assess results in context with River Continuum Concept (see

attachment) and how data changes from upper sites to lower sites.

  • b. Graph the data over time or space (site 1-3 done on the same

day on the same river).

  • c. Compare the values to a benchmark or water quality standard

if it exists

  • d. Calculate summary statistics such as the maximum,

minimum, range, mean, median, and IQ ranges (interquartile).

  • e. Record observations and findings
  • f. Provide conclusions and recommendations – ask students

who may be presenting as a final assessment to take their preliminary data set and present it to the class as a draft. 2. Class Time. Each parameter group (like Temperature and DO) will present their conclusions and recommendations. Discussion will

  • follow. Weave in concepts such as:

 Stressor, exposure, response  Exceedances of water quality standards related to frequency, duration, magnitude, and natural vs. human causation.

  • 4. What to provide students/participants

 A set of data for one or two parameters with dates when it was gathered  Graph paper  Background material on the parameter on what, why, and how it is measured and what the water quality standard is for the river (or have them do their own research and writing on this topic).  A set of data interpretation worksheets (see attached).

slide-5
SLIDE 5

Name: ________________________________________________

for NM Department of Game and Fish Share with Wildlife Lesson 3 – Turning Data into Information page 5

Data Interpretation Worksheet

  • 1. Names of the two parameters you’ll analyze?

For each parameter, list one reason it is important to measure for aquatic life or human health.

  • 2. How you would expect the results to change from upstream

to downstream taking the River Continuum Concept and land use in the watershed into consideration? Parameter Change Upstream to Downstream? Why?

slide-6
SLIDE 6

Name: ________________________________________________

for NM Department of Game and Fish Share with Wildlife Lesson 3 – Turning Data into Information page 6

  • 3. For each parameter, record how you predict this parameter

changes daily or with a summer rainstorm? Parameter OR Neutral Daily Change? OR Neutral Rainstorm Change?

  • 4. Graph the two parameters at the location. Connect each

point by parameter to make a line with distinct colors. Label each axis appropriately and give the graph a legend & title that is clear. See example below.

Location Temperature – Degrees Celcius DO, mg/l Title Site 1

slide-7
SLIDE 7

Name: ________________________________________________

for NM Department of Game and Fish Share with Wildlife Lesson 3 – Turning Data into Information page 7

  • 5. For each parameter, is there a standard or benchmark that

should not be exceeded? (look on your datasheet) Add benchmark if you have them and also to your graph. Parameter Benchmark Y or N If Benchmark what is it?

  • 6. For each parameter, calculate the following summary

statistics and put the results in the following table. Maximum data point (highest value in dataset) Minimum data point (lowest value in dataset) Range (maximum to minimum values) Why?

Parameter Max (which site & what date & time

  • f day?)

Min (which site& what date & time of day?) Range Why was there variation?

slide-8
SLIDE 8

Name: ________________________________________________

for NM Department of Game and Fish Share with Wildlife Lesson 3 – Turning Data into Information page 8

  • 7. Calculate summary statistics that represent the spread or

diversity of the data set.

Parameter Mean 25% IQ Range Median 75% IQ Range

  • 8. Record you findings and observations. Just list them. The

tools you have include:  The River Continuum concept, daily and rainstorm predictions of what these parameters “should” do  The graph of what each parameter “did” do this year. How does it compare with your predictions? Are there any patterns between parameters or within parameters?  If you have a benchmark, was the benchmark exceeded? If so what might this mean? If not what might that mean?  Does the maximum, minimum, range and mean look like it would be okay for aquatic life? Human health?

  • 9. Summarize your conclusions and make a recommendation.

This is what you will present to the group in one minute as a “dry run”. Do a role play pretending that you have been hired to evaluate this data set for a client-- what would you tell them?

slide-9
SLIDE 9

Name: ________________________________________________

for NM Department of Game and Fish Share with Wildlife Lesson 3 – Turning Data into Information page 9

River Continuum Concept – Longitudinal River View

The River Continuum Concept (RCC) (Vannote et al, 1980) is the concept that a river is a predictable physical, chemical and biological continuum of attributes. Stream order can illustrate this. Visualize how physical habitat can change from upstream to downstream. For example, as the stream widens downstream, it gets deeper, the velocity slows, the gradient lessens, and discharge increases. Chemical attributes change as you travel downstream. Some of these changes can include: chemistry parameters:  temperature increases  dissolved oxygen decreases  turbidity goes up and clarity goes down  pH remains about the same (it may increase some)  most chemical variables increase One common physical attribute in rivers is pool/riffle ratio. Pools are deep areas in the river where water slows and gathers. Riffles are shallow fast moving areas in the river that produce riffles in the water. The larger the river, the larger the pool/riffle ratio. Pool/riffle ratio in small streams is less than one because there are more riffles. In medium streams the ration is 1:1, equal. In large streams the pool riffle ratio is greater than one as the river becomes a moving lake. For biological attributes, the types of organisms might be the same. For example, there will always be micro and macro organisms, aquatic vegetation and fish, but the species might vary. In Colorado, fish species range from cutthroat trout, to brook trout, rainbow and brown trout, suckers, longnose dace, and sculpin, to warm water species like creek chubs, shiners, daces, and catfish. Colorado does not have large enough rivers to support large communities of zooplankton. Zooplankton occurs in our rivers as escapees of reservoirs or lakes. For macroinvertebrates we have the three indicators of clean cold water, mayflies, stoneflies and caddisflies in small and medium streams, disappearing in large

  • streams. For macroinvertebrates we also can look at the continuum of their

feeding niches, how they obtain food. Based upon millions of years of evolution, macroinvertebrates developed different feeding niches, such as predators, grazers (little cows on the rock grazing Periphyton), collectors (build nets and the like to

slide-10
SLIDE 10

Name: ________________________________________________

for NM Department of Game and Fish Share with Wildlife Lesson 3 – Turning Data into Information page 10

collect food) and shredders. In small rivers the food and energy source is Coarse Particulate Organic Matter (CPOM), debris and vegetation from the riparian zone. Thus, there are many shredders (like your tomato plant eaten by an insect), few grazers because the stream is cold, often shaded, days are short, growing season short, not much primary productivity to produce any fine organic matter for food. Conversely, in medium size streams, the stream opens, primary productivity produces plenty of Fine Particulate Organic Matter (FPOM). Thus the mayflies, stoneflies and caddisflies are all there, but specialize more in grazing and collection methods for FPOM. There are still shredders, just not as many. Finally, in large rivers the macroinvertebrate community is primarily collectors and

  • predators. Micro invertebrates change from primarily attached algae and mosses to

aquatic plants, less attached algae, to floating phytoplankton. RCC then also explains the primary energy sources for small, medium and large

  • streams. Small streams are primarily heterotrophic, or they do not have enough

photosynthesis and primary productivity to sustain itself, they are dependent upon the surrounding watershed and allocthonous (non-native material, coming in from

  • utside like leaves and twigs) or CPOM material. Medium streams are wider,

lower elevation and warmer. Primary production and photosynthesis increase in response, sufficient enough to sustain itself, thus medium streams are autotrophic (self) and major energy source is the algae and aquatic plants reduced to FPOM. Large streams return to heterotrophic, because they tend to be turbid and sunlight

  • nly penetrates in the top few meters. Thus, their primary energy source is not the

surround watershed like small streams but all the CPOM and FPOM from the small and medium size streams that flow into it. See Figure 1A and 1B to illustrate the RCC.

slide-11
SLIDE 11

Name: ________________________________________________

for NM Department of Game and Fish Share with Wildlife Lesson 3 – Turning Data into Information page 11