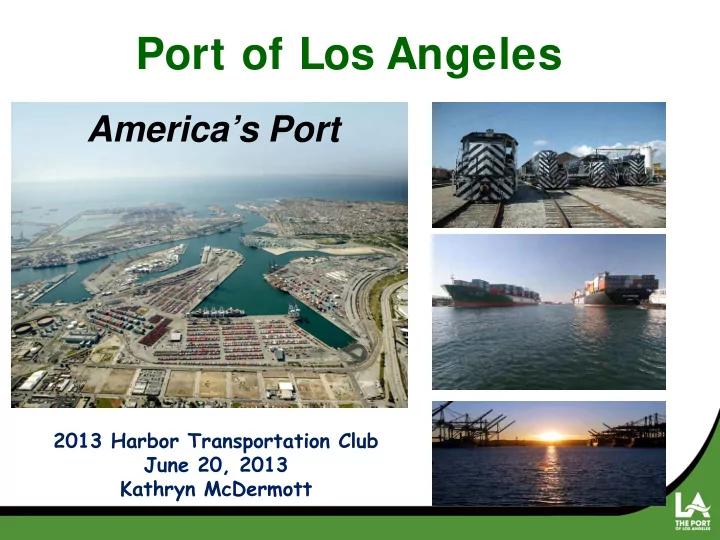
Port of Los Angeles Americas Port 2013 Harbor Transportation Club - - PowerPoint PPT Presentation

port of los angeles
SMART_READER_LITE
LIVE PREVIEW

Port of Los Angeles Americas Port 2013 Harbor Transportation Club - - PowerPoint PPT Presentation

Port of Los Angeles Americas Port 2013 Harbor Transportation Club June 20, 2013 Kathryn McDermott Battle for Discretionary Cargo Prince Rupert Sea/Tac Eastern Canada NY/NJ OAK Norfolk LA/LB Savannah Jacksonville Depth 50 or


slide-1
SLIDE 1

America’s Port

2013 Harbor Transportation Club June 20, 2013 Kathryn McDermott

Port of Los Angeles

slide-2
SLIDE 2
slide-3
SLIDE 3

Battle for Discretionary Cargo

LA/LB OAK Sea/Tac Houston Mobile Jacksonville Savannah Norfolk NY/NJ Lazaro Cardenas Prince Rupert Eastern Canada

Depth 50’ or greater Depth 45’ or less

slide-4
SLIDE 4

Panama/ Suez Canals

  • Panama Canal
  • Opens 2015
  • Tolls will increase – today

$85/TEU, could be over $100/TEU after opening

  • Line haul cost savings will be the

key

  • Who sees that savings?
  • Are East Coast Ports ready?
  • Suez Canal
  • Handle much larger ships
  • Going to USEC via stops in MED
  • Better cost utilization
  • However, need more ships in the

rotation

4

slide-5
SLIDE 5

5

So Wha hat Are We Doing ng To S St ay C Com pet it ive ve?

slide-6
SLIDE 6

Capital I mprovement Program

$87.9 $96.0 $102.5 $96.6 $179.6 $305.0 $233.1 $142.8 $236.0 $399.0 $0 $50 $100 $150 $200 $250 $300 $350 $400 $450

2005 (Actual) 2006 (Actual) 2007 (Actual) 2008 (Actual) 2009 (Actual) 2010 (Actual) 2011 (Actual) 2012 (Actual) 2013 (Estimated) 2014 (Proposed)

Capital Expenditures (in millions $)

Fiscal Year Actual Estimated Proposed

slide-7
SLIDE 7

Key Upcoming Projects

Cargo Terminals & Rail:

1. TRAPAC : backland and on-dock rail 2. Yang Ming: new wharf and additional

rail

3. China Shipping: backland and wharf

extension

4. Evergreen: upgraded wharf 5. YTI : upgraded wharf and additional rail 6. APL: new wharf and backland 7. Ports America: short-term permit 8. I CTF: modernization 9. BNSF/ SCI G: new rail yard 10. Dredging: main channel dredged to -53’

Roadway I nfrastructure:

A. South Wilmington grade separation B. C Street interchange C. Vincent Thomas/Harbor Blvd interchange

1 2 3 4 5 6 8 9 7 10

slide-8
SLIDE 8
  • Providing ships with

shore power

  • Program commenced

at POLA in 2004

  • 10 berths have

infrastructure in place

Alternative Maritime Power

slide-9
SLIDE 9

Bigger Ships

  • LA/ LB & West Coast
  • Largest ship 13,000TEU
  • Avg. size from Asia at POLA

is 7200TEU

  • Will see increase this year

and in 2014 – around 10%

  • Newest Ships
  • Still going Asia to Europe
  • 18,000TEU will be loading

cargo July 1, 2013!

  • New orders for 18,400TEU
  • Cascade effect
  • New markets

9

slide-10
SLIDE 10

Customer I nitiatives

  • Requesting

terminal expansion

  • Raising cranes
  • Alternative fuel

yard equipment

  • Automation

10

slide-11
SLIDE 11

Wha hat Are Our ur Adva vant nt ages?

slide-12
SLIDE 12

12

Los Angeles Offers One of the Most Extensive Transportation Networks in the World

Chicago Shanghai Sydney London

  • LA/ LB ports are the

largest container-shipping facilities in the U.S.

  • LA’s Alameda Corridor is

the busiest intermodal rail yard in the nation: 100 trains per day to 13 U.S. markets

  • Best rail connectivity
  • LA/ LB is ‘big ship ready’

LAX is the 1 3 th busiest airport in the w orld

L.A. port com plex handles 4 4 % of all containerized im ports into the U.S.

Ground transportation netw ork is far- reaching

L.A.’s rail yards m ove goods efficiently from W est to East Coast

Santiago Mexico City

L.A.

Tokyo

slide-13
SLIDE 13

Competitive Service Times

slide-14
SLIDE 14

Extensive Rail Network Connecting U.S.

LA El Paso Dallas Houston New Orleans Memphis

  • St. Louis

Chicago Omaha Denver SLC San Antonio Atlanta New York KC Columbus

slide-15
SLIDE 15

2012 San Pedro Bay Ports

I ntermodal and Local Cargo Flow

(I mport and Export Loads and Empties) Container Vessel

64% 25% 11% <1% Local Transit On-Dock Rail Near/ Off-Dock Rail Long-Haul Truck

San Pedro Bay Cargo Terminals

National Shipments/Direct Intermodal

*

* ~ includes 30% of trans-loaded cargo, Which is trucked/ railed domestically

15

slide-16
SLIDE 16

I ntermodal / Transload

  • Both So. Cal Ports depend on

intermodal

  • Trans loading allows for late

decisions on cargo

  • Better utilization of equipment
  • 5 international containers = 3

domestic 53’ containers

  • 14.5 million TEU in 2012

25% via on dock rail 11% via off dock rail

30% t t rans loaded 34% L Loc

  • cal
slide-17
SLIDE 17

Port of Los Angeles Advantages

  • Spending $1 million a day on improvements
  • 53’ deep draft - 50+ berths and 75 gantry cranes
  • 8 large containers facilities totaling 1628 acres, 7 of which have on-

dock rail

  • Over 100 trains into and out of San Pedro Bay per day
  • 1 billion square feet of warehousing within 80 miles from the Port
  • Over 11,000 drayage trucks that are model year 2007 or newer
  • Workforce of over 18,000 long shore personnel
  • Customer Outreach/Promotion
  • Trade Connect Program/LARExC
slide-18
SLIDE 18

Truck Program

  • POLA investment: $50 million
  • Since 2008 – 90% reduction in

truck emissions

  • Current fleet: 11,500 meeting

2007 emission standards

  • Supreme Court ruling - City will

not enforce the following:

  • Truck routes
  • Placards
  • Driver hiring

18

slide-19
SLIDE 19

Truck Driver I mproved Efficiency

  • MTO/ LMC/ Ports – turn time

improvement team

  • Data collection and sharing the results
  • Improved PierPass gate schedule

communication

  • Discussion over consistent fifth gate,

lunch hour relief, flex gates, gates following stop work meetings

  • Discussion regarding appointments,

6pm queue, and peak mitigation fee pricing

  • Appointment system
  • Ports of LA/ LB – chassis operations

committee

19

slide-20
SLIDE 20

2013 and Beyond

  • Current YTD – POLA down

7.52%

  • SP Bay is up on .7% in

May, YTD 2.5%

  • Vessel upsizing taking place

now

  • SP Bay end the year 3%

higher than last year

20

slide-21
SLIDE 21

Thank you

21