Los Angeles County Los Angeles County Regional DMMP Regional DMMP - - PowerPoint PPT Presentation

los angeles county los angeles county regional dmmp
SMART_READER_LITE
LIVE PREVIEW

Los Angeles County Los Angeles County Regional DMMP Regional DMMP - - PowerPoint PPT Presentation

Los Angeles County Los Angeles County Regional DMMP Regional DMMP Pilot Studies Pilot Studies Presented to Presented to Contaminated Sediments Task Force Presented by Presented by U.S. Army Corps of Engineers Anchor Environmental


slide-1
SLIDE 1

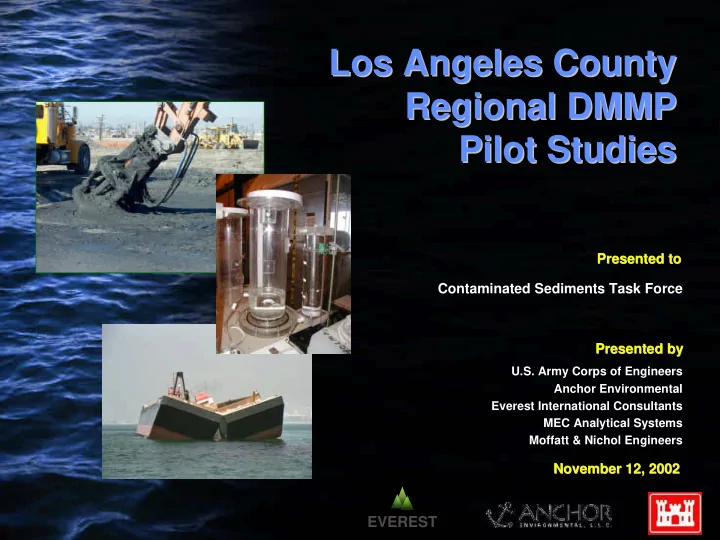
U.S. Army Corps of Engineers Anchor Environmental Everest International Consultants MEC Analytical Systems Moffatt & Nichol Engineers

Los Angeles County Los Angeles County Regional DMMP Regional DMMP Pilot Studies Pilot Studies

Presented to Presented to Presented by Presented by November 12, 2002 November 12, 2002 Contaminated Sediments Task Force

EVEREST

slide-2
SLIDE 2

Overview of Pilot Study Overview of Pilot Study Objectives Objectives

  • Program Objective - Evaluate the technical

issues and potential environmental impacts associated with implementing each pilot study alternative. Each pilot study was evaluated by assessing specific criteria including short and long-term effectiveness, implementability, environmental impacts, and cost

slide-3
SLIDE 3

Cement Stabilization Pilot Study Cement Stabilization Pilot Study-

  • Objectives

Objectives

  • Evaluate Cement Stabilization effectiveness for

Evaluate Cement Stabilization effectiveness for treating contaminated sediments from Los Angeles treating contaminated sediments from Los Angeles County in a laboratory and field environment County in a laboratory and field environment

  • Evaluate operations parameters to assess Cement

Evaluate operations parameters to assess Cement Stabilization implementability in the region Stabilization implementability in the region

  • Evaluate cost parameters to assess Cement

Evaluate cost parameters to assess Cement Stabilization costs in the region Stabilization costs in the region

  • Evaluate potential environmental impacts of

Evaluate potential environmental impacts of Cement Stabilization Cement Stabilization

slide-4
SLIDE 4

Aquatic Capping Pilot Study Aquatic Capping Pilot Study-

  • Objectives

Objectives

  • LARE dredging site monitoring goals

LARE dredging site monitoring goals

  • Measure water quality parameters.

Measure water quality parameters.

  • Observe construction activities and assess if

Observe construction activities and assess if change in operations affected water quality change in operations affected water quality measurements. measurements.

  • Gather information on construction production

Gather information on construction production rates/ costs. rates/ costs.

slide-5
SLIDE 5

Objectives (cont.) Objectives (cont.)

  • NEIBP capping site monitoring goals

NEIBP capping site monitoring goals

  • Measure water quality parameters.

Measure water quality parameters.

  • Assess effectiveness of design criteria.

Assess effectiveness of design criteria.

  • Assess the construction methods.

Assess the construction methods.

  • Observe construction activities and assess if

Observe construction activities and assess if change in operations affected water quality change in operations affected water quality measurements. measurements.

  • Gather information on construction production

Gather information on construction production rates/ costs. rates/ costs.

  • Establish baseline conditions for comparison

Establish baseline conditions for comparison against future monitoring events against future monitoring events

slide-6
SLIDE 6

Sediment Washing Pilot Study Sediment Washing Pilot Study-

  • Objectives

Objectives

  • Evaluate the effectiveness, feasibility,

Evaluate the effectiveness, feasibility, environmental impacts and cost to reduce chloride environmental impacts and cost to reduce chloride and TDS concentrations in marine sediments and TDS concentrations in marine sediments sufficiently to allow upland beneficial use sufficiently to allow upland beneficial use

  • ID candidate sediment washing processes and

ID candidate sediment washing processes and equipment equipment

  • Evaluate effectiveness at removing contaminants

Evaluate effectiveness at removing contaminants

  • Collect information to allow full scale costs to be

Collect information to allow full scale costs to be estimated estimated

slide-7
SLIDE 7

Sediment Blending Pilot Study Sediment Blending Pilot Study-

  • Objectives

Objectives

  • Evaluate the effectiveness, implementability,

Evaluate the effectiveness, implementability, environmental impacts, and costs associated with environmental impacts, and costs associated with blending contaminated sediment with various other blending contaminated sediment with various other materials to create either industrial grade fill, materials to create either industrial grade fill, structural fill, or for disposal in a waste landfill structural fill, or for disposal in a waste landfill

  • Survey local contractors and recipients of dredge

Survey local contractors and recipients of dredge material to review current practices for use material to review current practices for use

slide-8
SLIDE 8
  • Bench Scale Study

Bench Scale Study

  • Marina del

Marina del Rey Rey, LA River Estuary,POLB Channel , LA River Estuary,POLB Channel 2, POLA Consolidated Slip 2, POLA Consolidated Slip

  • Field Pilot Study

Field Pilot Study

  • POLA Anchorage Road Disposal Site

POLA Anchorage Road Disposal Site

  • Primary objective for bench study to provide guidance

Primary objective for bench study to provide guidance for field study for field study

  • Due to scheduling and budget constraints, field pilot

Due to scheduling and budget constraints, field pilot commenced prior to completion of bench study commenced prior to completion of bench study

  • Pilot team review preliminary results from bench

Pilot team review preliminary results from bench

Cement Stabilization Pilot Study Cement Stabilization Pilot Study-

  • Overview

Overview

slide-9
SLIDE 9

Presented by Russ Boudreau of Presented by Russ Boudreau of Moffatt Moffatt & Nichol Engineers & Nichol Engineers

Cement Stabilization Pilot Study Cement Stabilization Pilot Study-

  • Laboratory Bench Study

Laboratory Bench Study

slide-10
SLIDE 10

Presented by Presented by Chimin Chian Chimin Chian Everest International Consultants Inc. Everest International Consultants Inc.

Cement Stabilization Pilot Study Cement Stabilization Pilot Study-

  • Field Pilot Study

Field Pilot Study

slide-11
SLIDE 11

Aquatic Capping Construction Aquatic Capping Construction Components Overview Components Overview

  • Dredging contaminated sediment at LARE

Dredging contaminated sediment at LARE

  • 105,000 cubic meters

105,000 cubic meters

  • Placing contaminated sediment within the

Placing contaminated sediment within the NEIBP NEIBP

  • Dredging clean cap sediment from the

Dredging clean cap sediment from the SEIBP SEIBP

  • 66,000 cubic meters

66,000 cubic meters

  • Placing clean cap over the contaminated

Placing clean cap over the contaminated sediment within the NEIBP sediment within the NEIBP

slide-12
SLIDE 12

Aquatic Capping Pilot Study Aquatic Capping Pilot Study Chronology of Events Chronology of Events

  • Planning/design commence 1/01

Planning/design commence 1/01

  • NEPA EA approved 5/9/01

NEPA EA approved 5/9/01

  • LARE Dredging started 8/2/01

LARE Dredging started 8/2/01

  • LARE Placement completed 8/25/01

LARE Placement completed 8/25/01

  • Capping started 12/17/01

Capping started 12/17/01

  • Capping completed 1/16/02

Capping completed 1/16/02

  • Post Dredge monitoring completed mid

Post Dredge monitoring completed mid-

  • 2/02

2/02

  • Water and sediment quality data validated 8/02

Water and sediment quality data validated 8/02

slide-13
SLIDE 13

Aquatic Capping Pilot Study Aquatic Capping Pilot Study -

  • Engineering Design Overview

Engineering Design Overview

  • Cap thickness

Cap thickness

  • Cap stability against erosion

Cap stability against erosion

  • Bioturbation

Bioturbation

  • Contaminant mobility

Contaminant mobility

  • Cap consolidation

Cap consolidation

  • Placement methods

Placement methods

slide-14
SLIDE 14

Aquatic Capping Pilot Study Aquatic Capping Pilot Study -

  • Modeling Predictions

Modeling Predictions

  • Long

Long-

  • Term Effectiveness Modeling

Term Effectiveness Modeling

  • LTFATE

LTFATE

  • Recovery

Recovery

  • Bioturbation

Bioturbation

slide-15
SLIDE 15

Modeling Predictions (cont.) Modeling Predictions (cont.)

  • Environmental Impacts

Environmental Impacts

  • DREDGE

DREDGE

  • Elutriate Testing

Elutriate Testing

  • STFATE

STFATE

  • Implementability

Implementability

  • MDFATE

MDFATE

slide-16
SLIDE 16

Aquatic Capping Pilot Study Aquatic Capping Pilot Study – – Construction Photos Construction Photos

  • LARE Dredging

LARE Dredging

  • NEIBP Placement

NEIBP Placement

  • Capping

Capping

  • Water Quality Monitoring

Water Quality Monitoring

slide-17
SLIDE 17

Dredging at LARE

slide-18
SLIDE 18

Dredging Sequence

slide-19
SLIDE 19
slide-20
SLIDE 20
slide-21
SLIDE 21
slide-22
SLIDE 22
slide-23
SLIDE 23
slide-24
SLIDE 24
slide-25
SLIDE 25

Disposal Sequence

slide-26
SLIDE 26
slide-27
SLIDE 27
slide-28
SLIDE 28
slide-29
SLIDE 29
slide-30
SLIDE 30
slide-31
SLIDE 31
slide-32
SLIDE 32
slide-33
SLIDE 33

Capping Barge Placement

slide-34
SLIDE 34
slide-35
SLIDE 35
slide-36
SLIDE 36

Capping Rehandling Placement

slide-37
SLIDE 37
slide-38
SLIDE 38
slide-39
SLIDE 39

Water Quality Monitoring at LARE

slide-40
SLIDE 40
slide-41
SLIDE 41

Water Quality Monitoring at NEIBP

slide-42
SLIDE 42
slide-43
SLIDE 43
slide-44
SLIDE 44
  • LARE Dredge Monitoring

LARE Dredge Monitoring

  • NEIBP Placement

NEIBP Placement

  • SEIBP Dredge Monitoring

SEIBP Dredge Monitoring

  • Cap Placement

Cap Placement

  • Post

Post-

  • LARE Placement (pre

LARE Placement (pre-

  • cap)

cap)

  • Post

Post-

  • Cap Construction

Cap Construction

Aquatic Capping Pilot Study Aquatic Capping Pilot Study – – Water Quality and Construction Water Quality and Construction Monitoring Monitoring

slide-45
SLIDE 45

Water Quality and Construction Water Quality and Construction Monitoring Monitoring

Presented by David Moore of MEC Presented by David Moore of MEC Analytical Systems Analytical Systems

slide-46
SLIDE 46

LARE Dredging – Models vs. Data

20 40 60 80 100 120 140 25 50 75 100 125 150 175 200 225 250 Distance (m) TSS (mg/L)

Downstream Background Avg. Background Plus 1 STD Dredge Model Kuo Hayes Model

slide-47
SLIDE 47

Sediment Placement – Model vs. Data

1 10 100 1000 10000 50 100 150 200 250 Distance (m) TSS (mg/L)

10 minutes 30 minutes Background Avg Background Plus 1 STD Model 10 minutes Model 30 minutes

slide-48
SLIDE 48

Cap Dredging – Models vs. Data

50 100 150 200 250 25 50 75 100 125 Distance (m) TSS (mg/L)

Downstream Background Avg Background Plus 1 STD Dredge Model Kuo Hayes Model

slide-49
SLIDE 49

Cap Placement – Model vs. Data

50 100 150 200 250 50 100 150 200 250 Distance (m) TSS (mg/L)

Clamshell Split Hull @ 10 min Split Hull @ 30 min Background Avg. Background Avg. +1 STD Model Split Hull @ 10 min

slide-50
SLIDE 50

Cap Thickness Profile

slide-51
SLIDE 51

Aquatic Capping Pilot Study Aquatic Capping Pilot Study -

  • Lessons Learned

Lessons Learned

  • NEIBP foundation sediment is susceptible to

NEIBP foundation sediment is susceptible to displacement during sediment disposal. displacement during sediment disposal.

  • Displacement of resuspended foundation

Displacement of resuspended foundation sediment did not cause significant environmental sediment did not cause significant environmental impact. impact.

  • No appreciable difference in cap mixing using

No appreciable difference in cap mixing using bucket bucket rehandling rehandling versus controlled barge versus controlled barge discharge. discharge.

slide-52
SLIDE 52

Lessons Learned (cont.) Lessons Learned (cont.)

  • Dredging and disposal occurred at a faster rate

Dredging and disposal occurred at a faster rate than estimated than estimated. .

  • Bottom

Bottom-

  • dump barge placement need to be

dump barge placement need to be controlled near site boundaries to prevent controlled near site boundaries to prevent unintended placement outside the designated unintended placement outside the designated target area. target area.

  • Vibracoring

Vibracoring may provide excessive mixing of the may provide excessive mixing of the core profile. core profile.

  • Adaptive management is important to project

Adaptive management is important to project success. success.

slide-53
SLIDE 53
  • Overall Objective

Overall Objective

  • Reduction of Chloride and TDS

Reduction of Chloride and TDS

  • 30 mg/l Chloride

30 mg/l Chloride

  • 500 mg/l TDS

500 mg/l TDS

  • Specific Objectives

Specific Objectives

  • Identify suitable processes

Identify suitable processes

  • Evaluate feasibility at bench scale

Evaluate feasibility at bench scale

Sediment Washing Pilot Study Sediment Washing Pilot Study-

  • Laboratory Bench Study

Laboratory Bench Study

slide-54
SLIDE 54
  • Conducted by USACE ERDC (WES)

Conducted by USACE ERDC (WES)

  • Phase I

Phase I

  • Literature/industry search

Literature/industry search

  • Phase II

Phase II

  • Bench scale testing

Bench scale testing

Sediment Washing Pilot Study Sediment Washing Pilot Study-

  • Laboratory Bench Study

Laboratory Bench Study

slide-55
SLIDE 55
  • Literature Search Results

Literature Search Results

  • No documented case studies

No documented case studies

  • Candidate processes

Candidate processes

  • Passive washing

Passive washing

  • CDF placement/leaching

CDF placement/leaching

  • Mechanical washing

Mechanical washing

  • Plate & frame filter cake washing

Plate & frame filter cake washing

  • Counter current washing

Counter current washing

Sediment Washing Pilot Study Sediment Washing Pilot Study-

  • Laboratory Bench Study

Laboratory Bench Study

slide-56
SLIDE 56
  • Bench Testing

Bench Testing

  • Sediment/Site Water Characterization

Sediment/Site Water Characterization

  • Chemical analysis (

Chemical analysis (Cl Cl, TDS, metals) , TDS, metals)

  • Geotechnical

Geotechnical testing testing

  • Modeling washing processes

Modeling washing processes

  • Cake washing curves

Cake washing curves

  • Evaluate post

Evaluate post-

  • washing releases

washing releases

Sediment Washing Pilot Study Sediment Washing Pilot Study-

  • Laboratory Bench Study

Laboratory Bench Study

slide-57
SLIDE 57
  • Column Testing

Column Testing

  • Model passive washing

Model passive washing

  • Pressure Filter Testing

Pressure Filter Testing

  • Model mechanical washing

Model mechanical washing

Sediment Washing Pilot Study Sediment Washing Pilot Study-

  • Laboratory Bench Study

Laboratory Bench Study

slide-58
SLIDE 58

Sediment Washing Pilot Study Sediment Washing Pilot Study-

  • Laboratory Bench Study

Laboratory Bench Study

  • Column Testing Procedures

Column Testing Procedures

  • Material prep

Material prep

  • Load & decant

Load & decant

  • Surcharge

Surcharge

  • Washing (continuous)

Washing (continuous)

  • Filtrate sampling & analysis

Filtrate sampling & analysis

  • Cake sampling & analysis

Cake sampling & analysis

  • Secondary

Secondary extraction/equilibration extraction/equilibration

slide-59
SLIDE 59

Sediment Washing Pilot Study Sediment Washing Pilot Study-

  • Laboratory Bench Study

Laboratory Bench Study

  • Pressure Filter Testing

Pressure Filter Testing

  • Loading & sampling as for

Loading & sampling as for column tests column tests

  • Batch operation

Batch operation

  • Cake washing

Cake washing

  • Cake sampling & analysis

Cake sampling & analysis

  • Residual testing

Residual testing

slide-60
SLIDE 60

Sediment Washing Pilot Study Sediment Washing Pilot Study-

  • Laboratory Bench Study

Laboratory Bench Study

PF4, PF6 PF4, PF6 PF3, PF5 PF3, PF5 PF1, PF2, PF1, PF2, PF7 PF7 Pressure Filter Tests Pressure Filter Tests SC2, SC5 SC2, SC5 N/A N/A SC3, SC4 SC3, SC4 Column Tests Column Tests (surcharged) (surcharged) CT4, CT6 CT4, CT6 CT3, CT5 CT3, CT5 CT1,CT2 CT1,CT2 Column Tests Column Tests (unconsolidated) (unconsolidated) Fines Fines Sand Sand Bulk Bulk

slide-61
SLIDE 61

Sediment Washing Pilot Study Sediment Washing Pilot Study-

  • Laboratory Bench Study

Laboratory Bench Study

  • Study Goals

Study Goals

  • Volume water versus volume voids

Volume water versus volume voids

  • Residence time

Residence time – – f (flow rate & cake f (flow rate & cake thickness) thickness)

  • Volume water versus initial sediment

Volume water versus initial sediment volume or weight volume or weight

  • Post treatment cake and supernatant

Post treatment cake and supernatant concentrations concentrations

slide-62
SLIDE 62

Sediment Washing Pilot Study Sediment Washing Pilot Study-

  • Bench Study Column Results

Bench Study Column Results

60 60 CT6 Fines CT6 Fines 84 84 64 64-

  • 104

104 26 26 CT4 Fines CT4 Fines 3.1 3.1 CT5 Sand CT5 Sand 5.1 5.1 2.6 2.6-

  • 7.5

7.5 9.7 9.7 CT3 Sand CT3 Sand 8.4 8.4 CT2 Bulk CT2 Bulk 1.9 1.9 0.9 0.9-

  • 2.9

2.9 1.5 1.5 CT1 Bulk CT1 Bulk Mean Mean Vw/Vsed Vw/Vsed Ratio Ratio Wash Water to Wash Water to Sediment Ratio Sediment Ratio (Vw/Vsed) (Vw/Vsed) Void Void Volumes Volumes (Vw/Vv) (Vw/Vv) Test Test

slide-63
SLIDE 63

Sediment Washing Pilot Study Sediment Washing Pilot Study-

  • Bench Study Filter Results

Bench Study Filter Results

15 15 PF6 Fines PF6 Fines 20 20 12 12-

  • 27

27 21 21 PF4 Fines PF4 Fines 3.1 3.1 PF5 Sand PF5 Sand 1.75 1.75 1.7 1.7-

  • 1.8

1.8 6.1 6.1 PF3 Sand PF3 Sand 6.0 6.0 PF7 Bulk PF7 Bulk 2.5 2.5 2.4 2.4-

  • 2.6

2.6 7.6 7.6 PF2 Bulk PF2 Bulk Mean Mean Vw/Vsed Vw/Vsed Ratio Ratio Wash Water to Wash Water to Sediment Ratio Sediment Ratio (Vw/Vsed) (Vw/Vsed) Void Void Volumes Volumes (Vw/Vv) (Vw/Vv) Test Test

slide-64
SLIDE 64

Sediment Washing Pilot Study Sediment Washing Pilot Study-

  • Bench Study Surcharge Results

Bench Study Surcharge Results

15 15 SC5 Fines SC5 Fines 19 19 11 11-

  • 26

26 40 40 SC2 Fines SC2 Fines 12 12 SC4 Bulk SC4 Bulk 3.1 3.1 1.5 1.5-

  • 4.7

4.7 4.1 4.1 SC3 Bulk SC3 Bulk Mean Mean Vw/Vsed Vw/Vsed Ratio Ratio Wash Water to Wash Water to Sediment Ratio Sediment Ratio (Vw/Vsed) (Vw/Vsed) Void Void Volumes Volumes (Vw/Vv) (Vw/Vv) Test Test

slide-65
SLIDE 65

Sediment Washing Pilot Study Sediment Washing Pilot Study-

  • Laboratory Bench Study

Laboratory Bench Study

slide-66
SLIDE 66

Sediment Washing Pilot Study Sediment Washing Pilot Study-

  • Laboratory Bench Study

Laboratory Bench Study

slide-67
SLIDE 67

Sediment Washing Pilot Study Sediment Washing Pilot Study-

  • Bench Study Results

Bench Study Results

Comparison of Bulk Cake Contaminant Levels to Bulk Sediment Sample Contaminant Concentration as Percent of Bulk Sediment Concentrations (%) Cl- As Cd Cu Pb Hg Ni Zn Na Bulk Sediment Concentration (mg/kg) A 520 1.5J 0.7 19.3 35.4 0.05 11.6 94.9 2980 B 440 1.6J 0.7 19.4 81.1 0.05 10.6 96.1 2790 Bulk Cake Concentration as Percentage of Mean Bulk Sediment Concentration (%) CT1 3.1 132 91 115 61 113 124 104 16 CT2 45 116 73 86 23 113 89 89 16 PF2 36 142 104 116 45 123 104 128 18 PF7 3.5 90 69 67 19 82 64 67 11 SC3 10 110 84 105 100 140 93 104 9 SC4 31 103 71 105 29 120 79 109 9 Mean % 21.4 134 95 99 46 115 92 100 13

slide-68
SLIDE 68

Sediment Washing Pilot Study Sediment Washing Pilot Study-

  • Bench Study Results

Bench Study Results

33.9 0.034 0.008 0.00027 0.019 0.016 0.0005 0.019 1 518.3 11.4 SC Test 5 Fines 78.2 0.050 0.014 0.00004 0.027 0.028 0.0011 0.0037 6 586 5.5 SC Test 2 Fines 12.4 0.105 0.0145 0.00008 0.0365 0.039 <0.002 <0.015 2 703 6.55 PF Test 6 Fines 83.9 0.0365 0.0078 0.0000145 0.009 0.004 <0.0025 <0.015 1 495.3 4.05 PF Test 4 Fines 82.0 0.331 0.023 0.00022 0.141 0.160 0.0034 0.012J 2 510 9.5 C Test 6 (Fines) 544 0.015 0.0069J 0.00002J 0.0066 0.0062J <0.0025 0.012J 2014 780 C Test 4 (Fines) 20.3 0.134 0.0093 0.0001 0.0597 0.0293 0.0011 0.0074 2 204.7 3.87 PF Test 5 Sand 28.5 0.164 0.011B 0.000159 0.066 0.031 0.001 0.004 1 235.3 7.03 PF Test 3 Sand 22.63 0.32 0.02 0.000223 0.14 0.07 0.00293 0.01 2 238.3 4.93 C Test 5 (Sand) 26.6 0.06 0.01J 0.0000433 0.02 0.01 0.0013 0.01 297.3 4.9 C Test 3 (Sand) 21.9 0.057 0.0077 0.00003 0.016 0.012 0.0047 <0.015 3 457.3 3.73 SC Test 4 Bulk 30.17 0.165 0.0176 0.00016 0.37 0.066 0.00087 0.0067 2 326.3 6.03 SC Test 3 Bulk 87.17 0.212 0.019 0.00015 0.098 0.069 0.002 0.0087 2 567.7 17.0 PF Test 7 Bulk 67.1 0.10 0.013 0.000051 0.030 0.024 0.001 0.005 480.7 8.33 PF Test 2 Bulk 82.27 0.33 0.11 0.000059 0.07 0.02 0.0009J 0.0048J 546.67 5.7 C Test 2 (Bulk) 81.2 0.033 0.0056 0.00004 <0.010 0.0056 <0.0025 0.011 781 3.43 C Test 1 (Bulk) Na Zn Ni Hg Pb Cu Cd As

  • No. 24-hr

Equilibration Periods TDS Cl Constituent Concentrations (mg/L) Test

slide-69
SLIDE 69

Sediment Washing Pilot Study Sediment Washing Pilot Study-

  • Bench Study Summary

Bench Study Summary

  • High variability

High variability

  • Vw/Vsed range 1.5

Vw/Vsed range 1.5-

  • 60

60

  • f (grain size, flow rate)

f (grain size, flow rate)

  • Low/intermittent flow regime optimal

Low/intermittent flow regime optimal

  • Minimize Vw required

Minimize Vw required

  • Minimize Na and

Minimize Na and Cl Cl cake residuals cake residuals

  • Minimize subsequent

Minimize subsequent Cl Cl & TDS releases & TDS releases

slide-70
SLIDE 70
  • Original intent was to conduct

Original intent was to conduct laboratory bench studies to develop laboratory bench studies to develop performance curves performance curves

  • Literature review and user’s survey

Literature review and user’s survey suggested laboratory studies would suggested laboratory studies would not be useful not be useful

Sediment Blending Pilot Study Sediment Blending Pilot Study-

  • Overview

Overview

slide-71
SLIDE 71
  • Examples of past uses of dredge

Examples of past uses of dredge material material

  • Construction fill

Construction fill

  • Landfill daily cover

Landfill daily cover

  • Road base fill

Road base fill

  • Cement

Cement-

  • based mixes

based mixes

  • Manufactured soils

Manufactured soils

Sediment Blending Pilot Study Sediment Blending Pilot Study-

  • Literature Review

Literature Review

slide-72
SLIDE 72
  • Examples of blending materials

Examples of blending materials

  • Clean sand

Clean sand

  • PROPAT (shredded auto fiber)

PROPAT (shredded auto fiber)

  • Organic materials (biosolids)

Organic materials (biosolids)

  • Cement/Lime/Kiln Dust

Cement/Lime/Kiln Dust

Sediment Blending Pilot Study Sediment Blending Pilot Study-

  • Literature Review

Literature Review

slide-73
SLIDE 73
  • Interviewed

Interviewed

  • Ports

Ports

  • Contractors

Contractors

  • Consultants

Consultants

  • Agencies

Agencies

Sediment Blending Pilot Study Sediment Blending Pilot Study-

  • User’s Survey

User’s Survey

slide-74
SLIDE 74
  • Results

Results

  • Dredge materials not currently blended

Dredge materials not currently blended prior to use for regional projects prior to use for regional projects

  • With the exception of landfill daily

With the exception of landfill daily cover, no local beneficial use for cover, no local beneficial use for contaminated dredge materials contaminated dredge materials

  • Dredge materials layered in fill and

Dredge materials layered in fill and “managed” after construction “managed” after construction

Sediment Blending Pilot Study Sediment Blending Pilot Study-

  • User’s Survey

User’s Survey

slide-75
SLIDE 75

Sediment Blending Pilot Study Sediment Blending Pilot Study-

  • Example Landfill Cross

Example Landfill Cross-

  • Section

Section

slide-76
SLIDE 76
  • Sediment Blending not currently

Sediment Blending not currently conducted for purpose of re conducted for purpose of re-

  • using

using contaminated dredge materials contaminated dredge materials

  • Sediment Blending not conducted

Sediment Blending not conducted regionally by typical users of dredge regionally by typical users of dredge material material

  • Sediment Blending is technically feasible,

Sediment Blending is technically feasible, but is expensive and typically does not but is expensive and typically does not bind contaminants bind contaminants

Sediment Blending Pilot Study Sediment Blending Pilot Study-

  • Conclusions

Conclusions

slide-77
SLIDE 77

Pilot Study Pilot Study-

  • Program Conclusions

Program Conclusions

  • Aquatic Capping and Cement Stabilization appear

Aquatic Capping and Cement Stabilization appear capable of managing contaminated sediments. capable of managing contaminated sediments.

  • Sediment Washing and Sediment Blending appear

Sediment Washing and Sediment Blending appear to be technically feasible alternatives with many to be technically feasible alternatives with many limitations. limitations.

  • There is less flexibility in implementing the

There is less flexibility in implementing the treatment alternatives (Cement Stabilization, treatment alternatives (Cement Stabilization, Sediment Washing, Sediment Blending). Sediment Washing, Sediment Blending).

  • There is greater cost uncertainty associated with

There is greater cost uncertainty associated with implementing a treatment alternative than with implementing a treatment alternative than with implementing Aquatic Capping implementing Aquatic Capping

slide-78
SLIDE 78

Questions / Discussion