Proposed Wharfage Rate Increases NOVEMBER 2016 HAWAIIS COMMERCIAL - - PowerPoint PPT Presentation

proposed wharfage
SMART_READER_LITE
LIVE PREVIEW

Proposed Wharfage Rate Increases NOVEMBER 2016 HAWAIIS COMMERCIAL - - PowerPoint PPT Presentation

DEPARTMENT OF TRANSPORTATION Proposed Wharfage Rate Increases NOVEMBER 2016 HAWAIIS COMMERCIAL HARBOR SYSTEM BRINGS IN 98% OF ALL GOODS IMPORTED INTO HAWAII THE SYSTEM MUST COVER ALL ITS OWN COSTS TO OPERATE 10 COMMERCIAL HARBORS


slide-1
SLIDE 1

Proposed Wharfage Rate Increases

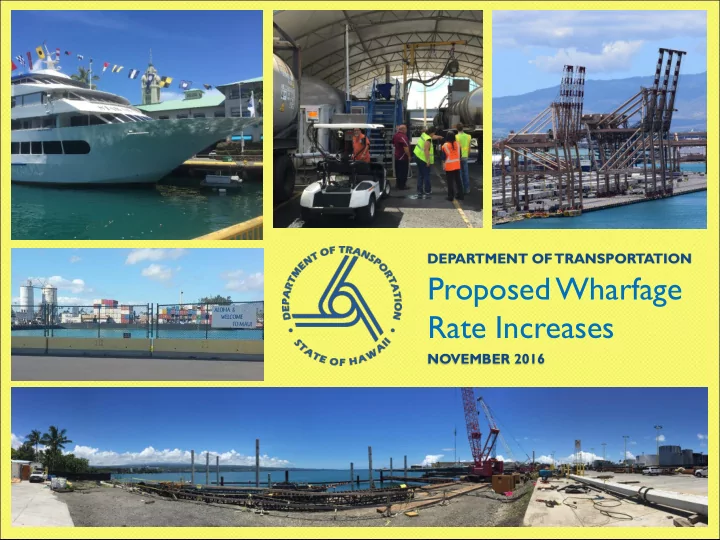
DEPARTMENT OF TRANSPORTATION NOVEMBER 2016

slide-2
SLIDE 2

HAWAII’S COMMERCIAL HARBOR SYSTEM BRINGS IN 98% OF ALL GOODS IMPORTED INTO HAWAII THE SYSTEM MUST COVER ALL ITS OWN COSTS TO OPERATE 10 COMMERCIAL HARBORS USER RATES MUST BE INCREASED TO FUND NEEDED IMPROVEMENTS SO THE HARBOR SYSTEM CAN ADEQUATELY SUPPORT THE STATE’S ECONOMY

slide-3
SLIDE 3

The Harbors & Hawaii

 The harbors system is Hawaii’s lifeline

  • 80% of goods consumed are imported
  • 98% enter Hawaii through the Harbors

 Every resident of Hawaii relies on the

goods that arrive through the harbors

  • Food, fuel/energy, necessities
slide-4
SLIDE 4

A hub-and-spoke system

slide-5
SLIDE 5

A Financial Snapshot

 Receives no federal or state

funding

 Annual operations cost:

$97M

 247 Staff members run the

system

 Charges harbor use fees to

cover costs

 ALL collected fees, tariffs,

and rent are re-invested into the harbor system

slide-6
SLIDE 6

Our Financial Responsibility

 Since 2010,we changed how we manage

the system’s finances

 We have $137M in cash reserves for

emergencies/disasters

 We defeased (paid off) old bonds with

extra cash reserves

 We have strong bond ratings (A+, A2)  We can finance future projects at lowest

costs and interest rates possible

slide-7
SLIDE 7

DEPARTMENT OF TRANSPORTATION HARBORS DIVISION

Summary of Financial Results and Projections (FY 2012-2018)

Unaudited Fiscal Year 2012 2013 2014 2015 2016 2017 2018 Operating Revenues Services $71,951 $82,622 $92,356 $98,435 $105,664 $107,366 $129,582 Rentals 28,980 27,922 26,720 23,413 23,049 23,853 24,839 Other revenues 2,946 2,127 2,262 1,361 898 898 898 Total Operating Revenues $103,877 $112,671 $121,338 $123,209 $129,611 $132,117 $155,319 Operating Expenses Before Depreciation $43,170 $47,203 $47,560 $46,805 $47,621 $51,905 $67,379 Income from Operations Before Depreciation $60,707 $65,468 $73,778 $76,404 $81,990 $80,212 $87,940 Add(1): Interest income(2) $801 $867 $673 $1,454 $1,624 $1,550 $1,454 Revenues Available for Debt Service $61,508 $66,335 $74,451 $77,858 $83,614 $81,762 $89,394 Harbors System Revenue Bond Debt Service(3) $27,770 $31,531 $31,528 $31,176 $31,187 $30,816 $35,671 Reimbursable General Obligation Bond Debt Service( 3,381 3,381 3,381 3,381 3,381 3,381 3,381 Total Harbors Debt Service per Bond Ratings Agencie $31,151 $34,912 $34,909 $34,557 $34,568 $34,197 $39,052 Aggregate Debt Service Coverage (5) 1.97 1.90 2.13 2.25 2.42 2.39 2.29 Projected ($000s) AUDITED

slide-8
SLIDE 8

A Financial Snapshot

 FY 2015

  • $123 M in revenue to the harbors
  • 76% of revenue ($93.6 M) derived from

wharfage rates

 Future

  • $450 M must be financed with bonds to

cover the costs of the Harbors Modernization Plan (HMP)

  • Bond financing requires additional

revenue now from increased fees

slide-9
SLIDE 9

Acting Now for Hawaii’s Future:

ACT 200 (2008)

“…Hawaii's and Hawaii's commercial ports statewide are experiencing competition for berthing rights for cargo, fuel, and cruise ship activities, and severe congestion in harbor facilities.”

slide-10
SLIDE 10

The Harbors Modernization Plan

ACT 200 (2008)

 Supported by Legislature, industry  Expands the harbor system capacity –

both the “hub” and “spokes”

 Addresses advancements in industry –

shifts to containers

 Makes system more adaptable  Addresses congestion and lack of available

space

slide-11
SLIDE 11

Harbor Modernization Plan:

KAPALAMA CONTAINER TERMINAL

 The heart of the HMP

, harbor system

 Locates a cargo yard in Kalihi in addition

to Sand Island

 Construction to begin Spring 2017  Project to be completed in two phases

  • ver 4 years

 Supports greater efficiencies which will

allow for decreased costs

  • Example: No drayage costs
slide-12
SLIDE 12

HONOLULU HARBOR: KAPALAMA CONTAINER TERMINAL ACT 200 (2008)

slide-13
SLIDE 13

HONOLULU HARBOR: KAPALAMA CONTAINER TERMINAL ACT 200 (2008)

slide-14
SLIDE 14

UH SOEST Pacific Shipyards and Atlantis Marine Spill Response Corp. Clean Island Council

Kapalama

2010-2016 Harbor Users’ Moves for Kapalama Container T erminal

Downtown Sand Island

slide-15
SLIDE 15

Harbor Modernization Plan

ACT 200 (2008) 2010 RATE INCREASE: $150 M BOND + CASH

 Completed Projects & Costs

  • $13 million Honolulu Piers 12 &15
  • $20 million Honolulu Pier 35 (UH SOEST)
  • $1 million Honolulu Pier 39 Shed Demolition
  • $5 million Kapalama Structures Demolition
  • $19 million Kapalama Design, Pre-construction
  • $21 million Kalaeloa Land Acquisition
  • $3 million Kalaeloa Fuel Pier Planning
  • $8 million Kawaihae Pier 2 Terminal Improvements
slide-16
SLIDE 16

Harbor Modernization Plan

ACT 200 (2008) 2010 RATE INCREASE: $150 M BOND + CASH

 Ongoing Projects & Costs

  • $6 million Honolulu Piers 24-28 Utility Improvements
  • $51 million Hilo Pier 4 Cargo Terminal
  • $15 million Kahului Land Acquisition
  • $1 million Hana Pier Planning

 Staffing Costs

  • $7 million or 5%
slide-17
SLIDE 17

Proposed Amendments to Chapter 19-44, HAR

 Reduces transshipment rates from 100% to 50% of

the prevailing wharfage rate

 Increases wharfage rates by 17%, 15%, and 15%,

2017-2019

 Increases pipeline rates for cement, liquids, fuel by

17%, 15%, and 15%, 2017-2019

 Authorizes annual increases 3% or CPI rate starting

July 1, 2019

 Adds security fee to wharfage fee schedule to

cover compliance with Homeland Security/Coast Guard requirements for harbor facilities

slide-18
SLIDE 18

Proposed Rate Increases

 TBD 2017 - 17% increase

  • Effective date depends on rules approval

 7/1/2017 – 15% increase  7/1/2018 – 15% increase  7/1/2019 + – 3% increase or CPI rate

slide-19
SLIDE 19

What do the new rates look like?

 Item: 40-foot container

  • f household goods

from the U.S. Mainland directly to Kahului

 Current rate:

$179.13

 Increased rate:

$208.69

slide-20
SLIDE 20

What do the new rates look like?

 Item: 40-foot

container of household goods from the U.S. Mainland through Honolulu to Kahului

 Current rate:

$378.15

 Increased rate:

$440.55

slide-21
SLIDE 21

What do the new rates look like?

 Item: A personal

car shipped from Honolulu to Nawiliwili

 Current rate:

$41.80

 Increased rate:

$48.70

slide-22
SLIDE 22

ANY QUESTIONS?